Download
1 / 6
60 likes | 88 Vues
This report presents reusable maps and graphs from the European Centre for Disease Prevention and Control (ECDC) on new measles cases per week in Romania, new malaria cases per week in Cape Verde, and the distribution of confirmed cases of A(H7N9) over five periods.

E N D
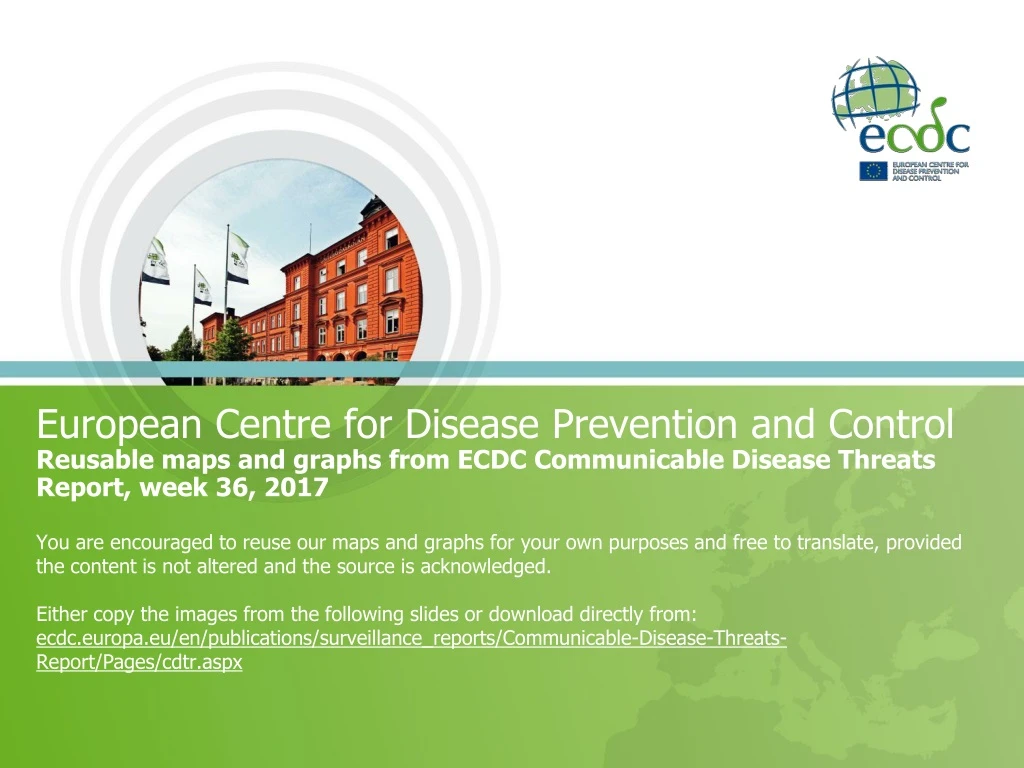
You are encouraged to reuse our maps and graphs for your own purposes and free to translate, provided the content is not altered and the source is acknowledged. Either copy the images from the following slides or download directly from: ecdc.europa.eu/en/publications/surveillance_reports/Communicable-Disease-Threats-Report/Pages/cdtr.aspx European Centre for Disease Prevention and Control Reusable maps and graphs from ECDC Communicable Disease Threats Report, week 36, 2017
New measles cases per week of reporting, week 2008-1 to 2017-35, Romania
New malaria cases per week of consultation, week 2017-1 to 2017-35, Cape Verde
Distribution of confirmed cases of A(H7N9) by five periods (weeks 7-2013 to 36-2017)
Distribution of confirmed cases of A(H7N9) weeks 7-2013 to 36-2017