Enhancing α-Calibration and Data Analysis for Proton Energy Loss Measurement
This document outlines a comprehensive approach to α-calibration within the energy range of 0-250, focusing on detectors 1-6. It emphasizes the importance of α-peaks and the mean differences of window gains for accurate energy loss measurements of protons across various materials, including Ca, Si, Al, Fe, and Cu. Key improvements include addressing waveform quality issues, defining geometry, and refining analysis code to incorporate monitoring and corrections for background asymmetries. The transition from executable to library format, along with input format changes to ROOT, enhances data processing efficiency.

Enhancing α-Calibration and Data Analysis for Proton Energy Loss Measurement
E N D
Presentation Transcript
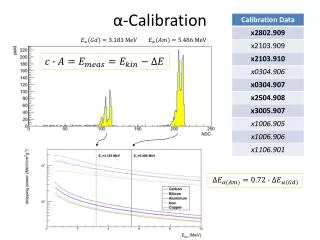
x2504.908 x-scale: 0-250 (detectors 1-3), 150-250 (detectors 4-6)
α-peaks entrancewindow mean of all windows mean difference of windows gains
Energy Loss of Protons Ca, Si, Al, Fe, Cu doesn’t depend on energy of normalization
Waveform Quality weird waveform(from calibration data) • Rise • Fall • Peak width
Finalizing the Asymmetries • Incorporate waveform quality into offline analysis code • Change from executable to library • Additional clean-up of global variables • Change configuration input from text to root format • Energy/time resolution • Geometry definition • Time dependent monitoring • Background asymmetries/correction with abort gaps • Long term: online procedure