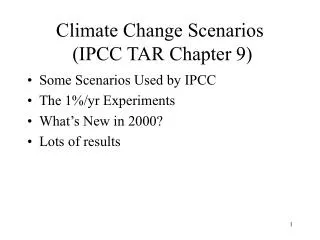
IPCC Emissions Scenarios
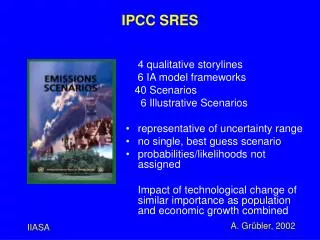
IPCC Emissions Scenarios . P.R. Shukla. Fossil and Industrial CO 2 - World. Global Cumulative Emissions (1990-2100). Share in Cumulative (1990 - 2100) Global Carbon Emissions. Cumulative Emission as % of WRE550. Non-Annex 1 Emissions . A1 Scenario. A2 Scenario. Non-Annex 1 Emissions .

IPCC Emissions Scenarios
E N D
Presentation Transcript
IPCC Emissions Scenarios P.R. Shukla
Non-Annex 1 Emissions A1 Scenario A2 Scenario Non-Annex 1 Emissions WRE550 - Annex 1 Emissions
Non-Annex 1 Emissions B1 Scenario B2 Scenario Non-Annex 1 Emissions WRE550 - Annex 1 Emissions
Per Capita Emissions A1 - Scenario A2 - Scenario
Per Capita Emissions B1 Scenario B2 Scenario
Per Capita GDP A1 - Scenario A2 - Scenario
Per Capita GDP B1 Scenario B2 Scenario
India: Carbon Mitigation (1995-2035) 60 6 billion tons of mitigation below $25/ ton of carbon 50 40 30 Marginal Cost ($/Ton of Carbon) 20 10 0 1 2 3 4 5 6 7 Carbon Mitigation (billion ton)
How Mitigation affects Electricity Price? Long Run Marginal Cost of Electricity 4.0 3.2 2.4 Rs. per kwh 1.6 0.8 0 1995 2005 2015 2025 2035 Reference 1 BT (5%) 2 BT (10%) 3 BT (15%) 4 BT (20%) 5 BT (25%)
How Mitigation affects Production Cost? ALUMINUM STEEL 250 350 300 200 250 150 Cost of Aluminum Production 200 Cost of Steel Production 100 150 50 100 50 0 2015 0 2035 2015 2035 1 BT (5%) 3 BT (15%) 5 BT (25%)
Cost and Ancillary Benefits of Carbon MitigationCase of India Marginal Cost and Ancillary Benefits Total Cost and Ancillary Benefits