Download
1 / 40
400 likes | 533 Vues
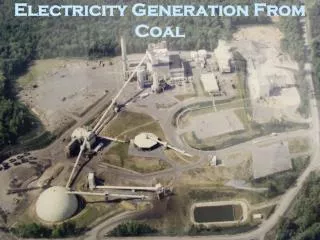
Emissions from Coal in High Wind Scenarios. David Luke Oates RenewElec Project Department of Engineering and Public Policy Carnegie Mellon University Advisor: Paulina Jaramillo USAEE Concurrent Session October 11, 2011. A baseloaded coal unit. A Texas Coal Unit. Source: CEMS 2008.

E N D
Emissions from Coal in High Wind Scenarios David Luke Oates RenewElec Project Department of Engineering and Public Policy Carnegie Mellon University Advisor: Paulina Jaramillo USAEE Concurrent Session October 11, 2011
A baseloaded coal unit A Texas Coal Unit Source: CEMS 2008
A coal unit being extensively cycled… Source: CEMS 2008
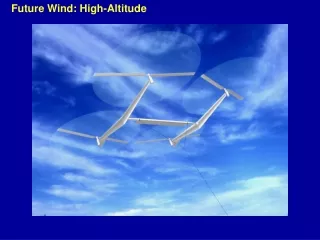
Wind power is intermittent and we can expect more of it • 29 States have RPS • Wind is most likely source to meet RPS • NREL: 30% energy from wind is feasible Aggregated output from 6 turbines Source: (J Apt 2007)
What is ‘cycling’? “increased start-ups, ramping and periods of operation at low load levels” (Troy et al. 2010) Part Load: Ramping: Startup:
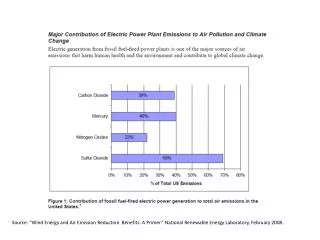
Two reasons we should care about cycling: Costs Emissions Coal units incur emissions penalties for part-load operation, ramping, and startups One estimate for starting up coal suggests a penalty of 100% for CO2, 300% for NOX and 250% for SO2 Sources: (Bentek2008; Lefton&Besuner 2006; D Lew 2011) • Cycling increases cost of operating a coal unit: • Increased O&M • Increased forced outage replacement power • Extra fuel costs • Challenging to quantify costs • One estimate: $15-$225 thousand/cycle
Research context and objectives Context Objectives Determine effect of wind penetration on coal: Startups Ramping Part load operation Calculate system-level economic benefits of coal cycling Determine emissions implications of coal cycling • NREL estimated coal cycling dependence on wind penetration • 1 measure of cycling • no sensitivity based on power system, fuel mix, etc. • Most studies use very simplistic emissions models
Two Important Data Sources CEMS EWITS Allows us to model different wind penetration levels Eastern Wind Integration and Transmission Study model results Modeled wind power output for thousands of sites across the country • Allows us to determine emissions impact of cycling • EPA’s Continuous Emissions Monitoring System • Hourly power output and CO2, SO2, NOX for electricity units > 25 MW
Three Big Questions: • How much coal cycling can we expect to see as wind penetration increases? • What is the value to the power system of coal cycling in high wind scenarios? • Determine the system-level economic benefit to compare with the private cost • How much does cycling affect emissions of CO2, NOX, and SO2 from coal units?
Part 1: Regression Analysis Overview Independent Variables Coal output time series Wind energy • Goal: What is correlation between wind penetration and cycling? • Focus on ERCOT • Years: 2007-2010 • Weekly Analysis • Conclusions • Need more sophisticated model to examine emissions
Part 2: Model Overview “What are the capacities of each unit and demand for electricity?” “How much power does each unit produce every hour?” “How much CO2, NOX and SO2 are produced?”
UCED model capacity mix is comparable to PJM Source: NEEDS 2006
Unit Commitment and Economic Dispatch (UCED) Characteristics Costs Constraints Supply = Demand Minimum Generation Capacity Ramp rate Min up / Min down Reserve requirement • Fuel • Startup • Shutdown • Reserve commitment • Wind curtailment
UCED Characteristics Continued • Minimizes total cost of meeting demand • Hourly Dispatch • Perfect Information • Daily dispatch, iterated through 1 year • Solved using Mixed Integer (Linear) Programming
Emissions Model Rationale • Many analyses assume constant emissions factors • This method does not adequately account for emissions associated with startup/shutdowns or ramping • Coal units incur emissions penalties for part-load operation, ramping, and startup Sources: (Katzenstein& Apt 2009; D Lew 2011; Bennett &McBee 2011)
Higher emissions rate during startup NOx emissions from a coal unit NOx emissions (kg/min) Power output (MW) Note: I’m going to eliminate the coloring Source: CEMS
Base Case: Validation Reference Model January Model June
Policy Implications Gives a clearer picture of how coal units behave with renewables • Renewable Portfolio Standards • Given that coal cycling occurs, how much emissions benefit do we see from RPS? • Electricity Market Structure • Given that cycling produces private costs and (maybe) social benefits, do we need to change the way we pay operators of coal units?
Acknowledgments • CEIC, RenewElec for financial support • Paulina Jaramillo for a great deal of guidance • Todd Ryan, Allison Weis for countless discussions • Bri Matthias-Hodge and NREL Wind Technology Center for help building my UCED model
References • Apt, J, 2007. The spectrum of power from wind turbines. Journal of Power Sources. • Bennett, P. &McBee, B., 2011. The Wind Power Paradox. pp.1–58. • D Lew, G.B.A.M.M.N., 2011. Does Wind Affect Coal? Cycling, Emissions, and Costs (Presentation), National Renewable Energy Laboratory (NREL). pp.1–21. • Energy, B., 2008. How Less Became More: Wind, Power, and Unintended Consequences in the Colorado Energy Market, • Katzenstein, W. & Apt, Jay, 2009. Air Emissions Due To Wind And Solar Power. Environmental Science & Technology, 43(2), pp.253–258. • Lefton, S.A. &Besuner, P., 2006. The Cost of Cycling Coal Fired Power Plants. Coal Power Magazine, (Winter 2006), pp.16–19. • Troy, N., Denny, E. & O'Malley, M., 2010. Base-Load Cycling on a System With Significant Wind Penetration. Power Systems, IEEE Transactions on, 25(2), pp.1088–1097.
EWITS Data Use • Average power available: 43 GW • 30% of PJM peak demand Locations of EWITS Sites near PJM region
EWITS data doesn’t match Kolmogorov below 3 h Source: Todd Ryan
Fleet Selector • DESCRIBE OPTIMIZATION
NREL suggests cycling increases with wind penetration Operating Level: No Wind 10% Wind 20% Wind 30% Wind Source: Western Wind and Solar Integration Study, NREL, 2010, p. 153
Timeline Accomplished Before January Implement forced/unforced outages Perform sensitivity on reserve requirements, fuel mix Build NOX and SO2 emissions models Run scenarios varying wind penetration and cycling constraints • Integrate data sources • Select representative fleets from available sources • Build CO2 emissions models • Implemented working UCED
Reserve Requirements 3+1 • Carry 1% of peak load for regulation is reasonable for modest penetration • Or Regulation equal to stddev of 10-min net load changes
Startups and Wind Penetration NOT ACTUAL DATA
System Costs and Startups NOT ACTUAL DATA Slope: $/startup
Anticipated Sensitive Parameters • Reserve rules • Contingency reserve margin • Regulating reserve margin • Fuel Mix • Amount of coal
Ramp Rate Definition • Output of each unit approximated by discontinuous stepwise curve • Ramp rate approximated by change in power output from hour to hour (MW/h)
Base Costs and Constraints • Show all costs and constraints
Fleet Selector • Problem 1: data on every unit in power systems not available • Problem 2: want to be able to test different fuel mixes • Problem 3: many differences between units of the same fuel type • Solution: program to match distributions of size and heat rate to reference system
Results summary for a particular wind penetration NOT ACTUAL DATA
Base Case: Validation Continued NOT ACTUAL DATA *Note that uncertainties are not yet available and will be included in final results