Download
1 / 18
180 likes | 203 Vues
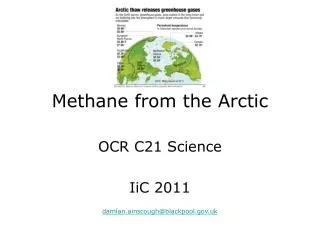
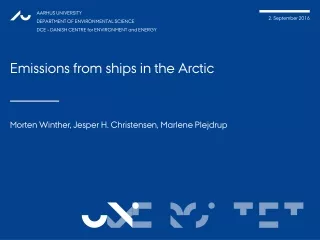
Emissions from ships in the Arctic. Introduction. Recently we made Black Carbon (BC) calculations for ships in the Arctic Our inventory area: North of 58.95 o N Years: 2012, 2020, 2030 and 2050. Introduction.

E N D
Introduction • Recentlywe made Black Carbon (BC) calculations for ships in the Arctic • Our inventory area: North of 58.95o N • Years: 2012, 2020, 2030 and 2050
Introduction • Navigation is one of the most important local emission sources in the Arctic • Emissions are being injected directly into the Arctic environment at low (chimney) heights • Black carbon (BC) emissions are of particular interest • It has the capability to absorb light over reflective areas (e.g. snow, ice) • It has a darkening effect when deposited on snow and ice
The emission inventory needs: • Traffic activity data: Sailed km’s for ship type/size classes • Fuel consumption: Estimated from fuel-power functions • BC emission factors: gBC/kg fuel
Traffic activity data for ships • Traffic data from the Danish Maritime Authority (DMA) based on satellite sampled AIS data • AIS (Automatic Information System): Transponder signals from ships with information about identity and position • High intensive traffic areas (coasts of Norway, Iceland, Faroe Islands and Baltic sea) covered by terrestrial base stations and AIS receivers • Outside these areas AIS data is gathered from two, sometimes three, polar orbital satellites
Activity data for ships • The AIS data is further processed by DMA into • Grid cell resolution: 0.5o x 0.225o long-lat • Average sailing speed and sailed distance per month in 2012 • 14 ship types, 16 ship length categories • Forecast years • Traffic prognosis from International Maritime Organization (IMO)1 is used to project 2012 traffic into 2020, 2030 and 2050 1Second IMO GHG Study 2009 (Buhaug et al. 2009)
Activity data for ships 1Second IMO GHG Study 2009 (Buhaug et al. 2009)
Emission are calculated per grid, by using ship activity data and engine fuel-power functions and fuel related EF’s. • The BC emissions from total navigation are shown on the upper figure • The fishing activities and hence emissions (lower figure) are to a large extent coastal specific. The emissions are highest along the Norwegian coast, around the Faroe and Shetland Islands and around Iceland
Fishing ships (45 %) is the largest emission source in 2012, followed by passenger ships, tankers, general cargo and container ships. • The total emissions of BC increase by 2 %, 4 % and 16 % in 2020, 2030 and 2050 • Mainly driven by growth for Container and Tanker ships • The decreasing emissions from fishing ships is a result of constant fishing activities assumed in the forecast years, and improved fuel efficiencies for the engines installed.
1Arctic shipping emissions inventories and future scenarios, Atmos. Chem. Phys., 10, 9689–9704 • Scenario results with traffic diversion along polar routes1, due to less arctic sea ice in the future • Two different growth rates for global navigation, and two different shares of Suez/Panama traffic using polar routes • Our BAU scenario: 90 % more BC (and fuel) in the arctic area in 2050 due to polar traffic • HiG scenario: 650 % more BC (and fuel) in the arctic area in 2050 due to polar traffic
How to mitigate BC • Ban the use of heavy fuel oil for ships in the Arctic? • Use of sulfur removal scrubber technology, which brings down BC also? • Use of LNG (Liquid Natural Gas) ships, with very low or zero BC emissions? • We examine this in a new project, which includes a future Sulfur Emission Control Area (SECA) for the Arctic • The scenario assumes different shares of ships, using MGO/MDO, LNG and scrubbers in the future
Ship engine power • Basis power demandfunctions (kW) areprovided by DTU per ship type • Propulsion power: Function of shiplength and sailing speed • Auxiliaryengine power demand is alsotakenintoaccount • Adjustment for improvedshipenergyefficiency is made in the forecastyears, per ship type, according to the IMO EEDI scheme • EEDI: Energy Efficiency Design Index: Mandatory energyefficiencyimprovements for new builtshipsstarting from 2013 • “The EEDI is a design index, primarily applicable to new ships, that has been developed by the IMO and is to be used as a tool for control of CO2 emissions from ships. The IMO aims to improve the energy efficiency of ships via mandatory implementation of the EEDI.”
Ship engine power – fishing vessels • Fixed engine load factor (60 %) for fishing vessels, due to unprecise power-speed relation (COWI Tromsø, 2013) • The sailing speeds (and hence sailing distances) are generally low during direct fishing. However, low sailing speeds do not automatically imply low engine loads for fishing ships. • Additional engine power is needed (which increases fuel consumption), either due to the nature of the fishing work (e.g. trawl fishing) or due to the power needed for the processing and packing of the fish catch at sea.
Fuel factors • Sfc data (g/kWh) from DTU and MAN Diesel & Turbo • Vessel type x Engine type x Engine life time relation in the model
BC % of PM from literature: 0.3-17 % for HFO and 12-40 % for MDO • The BC part of PM is low for HFO (high fuel S-%); sulphur bound PM dominates the total PM mass • We use a constant BC emission factor = 0,35 g/kg fuel (Corbett et al., 2010)1 • The soot mass of PM (BC) remain the same, sulphur related PM mass varies with fuel S-% 1Arctic shipping emissions inventories and future scenarios, Atmos. Chem. Phys., 10, 9689–9704
Engine work produced W = Work in kWh S = ship type f = fuel type k = engine type l = ship length (LPP) interval P = Power demand (kW) D = Distance (NM) V = Vessel average speed (knots) EEDIf = Energy Efficiency Design Index factor
Fuel and emission calculations E = Fuel consumption or emission (g) W = Engine work produced (kWh) EF = Fuel consumption or emission factor (g/kWh)