Introduction to Regression Lecture 5.1
590 likes | 695 Vues
This course provides an overview of regression analysis techniques, emphasizing the transformation of data for improved interpretation. Topics include liver fluke egg hatching rates, CEO remuneration, brain and body weights, simple linear regression, and quadratic fits. Various options for transforming and analyzing data are explored. The course also covers the use of t-values in regression analysis and how to interpret coefficient outputs. Homework assignments and solutions are provided to reinforce learning. Practical applications such as residential load survey data analysis are discussed, along with tips for handling multicollinearity issues.

Introduction to Regression Lecture 5.1
E N D
Presentation Transcript
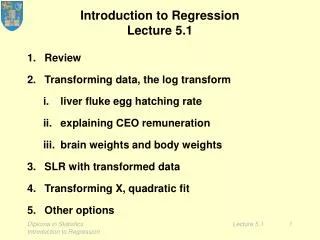
Introduction to RegressionLecture 5.1 • Review • Transforming data, the log transform • liver fluke egg hatching rate • explaining CEO remuneration • brain weights and body weights • SLR with transformed data • Transforming X, quadratic fit • Other options Diploma in Statistics Introduction to Regression
Using t values Convention: n >30 is big, n < 30 is small. Z0.05 = 1.96 ≈ 2 t30, 0.05 = 2.04 ≈ 2 Diploma in Statistics Introduction to Regression
Diploma in Statistics Introduction to Regression
Homework 4.2.1 Quantify the extent of the recovery in Year 6, Q3. = 1030 Q1 + 1292 Q2 + 1210 Q3 + 1279 Q4 + 33.7 Time Year 6 Q2: P = 1657 = 1292 + 33.7 × 22 = 2033 P – = 1657 – 2033 = – 376 Year 6 Q3: P = 2185 = 1210 + 33.7 × 23 = 1985 P – = 2185 – 1985 = 200 Diploma in Statistics Introduction to Regression
Homework 4.2.2 List correspondences between the output from the original regression and the output from the alternative regression. Confirm that the coefficients of Q1, Q2 and Q3 in the original are the corresponding coefficients in the alternative with the Q4 coefficient added. Diploma in Statistics Introduction to Regression
Predictor Coef SE Coef T P Noconstant Q1 1029.87 23.41 43.99 0.000 Q2 1292.35 24.45 52.85 0.000 Q3 1210.42 25.55 47.37 0.000 Q4 1278.70 26.71 47.88 0.000 Time 33.725 1.619 20.83 0.000 S = 40.9654 Predictor Coef SE Coef T P Constant 1278.70 26.71 47.88 0.000 Q1 -248.82 26.36 -9.44 0.000 Q2 13.65 26.11 0.52 0.609 Q3 -68.27 25.96 -2.63 0.019 Time 33.725 1.619 20.83 0.000 S = 40.9654 Diploma in Statistics Introduction to Regression
Homework 4.2.3 • Calculate the simple linear regressions of Jobtime on each of T_Ops and Units. Confirm the corresponding t-values. • Calculate the simple linear regression of Jobtime on Ops per Unit. Comment on the negative correlation of Jobtime with Ops per Unit in the light of the corresponding t-value. • Confirm the calculation of the R2 values. Diploma in Statistics Introduction to Regression
Solution 4.2.3 2. Calculate the simple linear regression of Jobtime on Ops per Unit. Comment on the negative correlation of Jobtime with Ops per Unit in the light of the corresponding t-value. Comment: The t-value is insignificant; the negative correlation is just chance variation, with no substantive meaning. Diploma in Statistics Introduction to Regression
Variance Inflation Factors Convention: problem if > 90% or VIFk > 10 Diploma in Statistics Introduction to Regression
What to do? • Get new X values, to break correlation pattern • impractical in observational studies • Choose a subset of the X variables • manually • automatically • stepwise regression • other methods Diploma in Statistics Introduction to Regression
Residential load survey data. Data collected by a US electricity supplier during an investigation of the factors that influence peak demand for electricity by residential customers. Load is demand at system peak demand hour, (kW) Size is house size, in SqFt/1000, Income (X2) is annual family income, in $/1000, AirCon (X3) is air conditioning capacity, in tons, Index (X4) is the house appliance index, in kW, Residents (X5) is number in house on a typical day Diploma in Statistics Introduction to Regression
Matrix plot Diploma in Statistics Introduction to Regression
Results All variables in: Predictor Coef SE Coef T P Constant 0.1263 0.2289 0.55 0.585 Size -2.6689 0.9059 -2.95 0.006 Income 0.00027912 0.00007892 3.54 0.001 AirCon 0.42462 0.03472 12.23 0.000 Index 0.00038137 0.00007884 4.84 0.000 Residents 0.00197 0.02218 0.09 0.930 Income deleted Predictor Coef SE Coef T P Constant -397.0 492.7 -0.81 0.426 Size 10943.3 594.2 18.42 0.000 AirCon -1.86 75.45 -0.02 0.980 Index 0.0721 0.1709 0.42 0.676 Residents 38.65 47.75 0.81 0.424 Diploma in Statistics Introduction to Regression
Exercise Calculate the VIF for Size. Comment. Homework Calculate variance inflation factors for all explanatory variables. Discuss Diploma in Statistics Introduction to Regression
Multicollinearity when when there is perfect correlation within the X variables. Example: Indicators Illustration: Minitab Diploma in Statistics Introduction to Regression
Introduction to RegressionLecture 5.1 • Review • Transforming data, the log transform • liver fluke egg hatching rate • explaining CEO remuneration • brain weights and body weightsA • SLR with transformed data • Transforming X, quadratic fit • Other options Diploma in Statistics Introduction to Regression
(i) Hatching of liver fluke eggs The life cycle of the liver fluke Diploma in Statistics Introduction to Regression
Hatching of liver fluke eggs:Duration and Success rate Diploma in Statistics Introduction to Regression
Diploma in Statistics Introduction to Regression
Diploma in Statistics Introduction to Regression
(ii) Explaining CEO Compensationand Company Sales,(Forbes magazine, May 1994) Diploma in Statistics Introduction to Regression
Explaining CEO Remuneration,bivariate log transformation Diploma in Statistics Introduction to Regression
(iii) Mammals' Brainweight vs Bodyweight Diploma in Statistics Introduction to Regression
Scatterplot view Diploma in Statistics Introduction to Regression
Scatterplot view,log transform Diploma in Statistics Introduction to Regression
Scatterplot view,Dinosaurs deleted Diploma in Statistics Introduction to Regression
Histogram view Diploma in Statistics Introduction to Regression
Histogram view,log transform Diploma in Statistics Introduction to Regression
Changing spread with log Diploma in Statistics Introduction to Regression
Changing spread with log Diploma in Statistics Introduction to Regression
Changing spread with log Diploma in Statistics Introduction to Regression
Changing spread with log Diploma in Statistics Introduction to Regression
Changing spread with log Diploma in Statistics Introduction to Regression
Changing spread with log Diploma in Statistics Introduction to Regression
Changing spread with log Diploma in Statistics Introduction to Regression
Changing spread with log Diploma in Statistics Introduction to Regression
Changing spread with log Diploma in Statistics Introduction to Regression
Why the log transform works High spread at high X transformed to low spread at high Y Low spread at low X transformed to high spread at low Y Diploma in Statistics Introduction to Regression
Why the log transform works 10 to 100 transformed to log10(10) to log10(102) i.e. 1 to 2 1/10 = 0.1 to 1/100 = 0.01 transformed to log10(10–1) to log10(10–2) i.e., – 1 to – 2 Diploma in Statistics Introduction to Regression
Introduction to RegressionLecture 5.1 • Review • Transforming data, the log transform • liver fluke egg hatching rate • explaining CEO remuneration • brain weights and body weights • SLR with transformed data • Transforming X, quadratic fit • Other options Diploma in Statistics Introduction to Regression
SLR with transformed dataLBrainW versus LBodyW The regression equation is LBrainW = 0.932 + 0.753 LBodyW Predictor Coef SE Coef T P Constant 0.93237 0.04170 22.36 0.000 LBodyW 0.75309 0.02858 26.35 0.000 S = 0.302949 Diploma in Statistics Introduction to Regression
Application:Do humans conform? Human Diploma in Statistics Introduction to Regression
Application:Do humans conform? • Delete the Human data, • calculate regression, • predict human LBrainW and • compare to actual, relative to s Diploma in Statistics Introduction to Regression
Application:Do humans conform? Regression Analysis: LBrainW versus LBodyW The regression equation is LBrainW = 0.924 + 0.744 LBodyW Predictor Coef SE Coef t p Constant 0.92410 0.03933 23.50 0.000 LBodyW 0.74383 0.02706 27.48 0.000 S = 0.285036 Diploma in Statistics Introduction to Regression
Application:Do humans conform? LBodyW(Human) = 1.79239 LBrainW(Human) = 3.12057 Predicted LBrainW = 0.924 + 0.744 × 1.79239 = 2.25754 Residual = 3.12057 – 2.25754 = 0.86303 Residual / s = 0.86303 / 0.285036 = 3.03 Diploma in Statistics Introduction to Regression
Deleted residuals For each potentially exceptional case: • delete the case • calculate the regression from the rest • use the fitted equation to calculate a deleted fitted value • calculate deleted residual = obseved value– deleted fitted value Minitab does this automatically for all cases! Diploma in Statistics Introduction to Regression
Application:Do humans conform? With 63 cases, we do not expect to see any cases with residuals exceeding 3 standard deviations. On the other hand, recalling the scatter plot, the humans do not appear particulary exceptional. The dotplot view of deleted residuals emphasises this: Water opossums appear more exceptional. Water Opossum Human Diploma in Statistics Introduction to Regression
Application:Do humans conform? Diploma in Statistics Introduction to Regression
Introduction to RegressionLecture 5.1 • Review • Transforming data, the log transform • liver fluke egg hatching rate • explaining CEO remuneration • brain weights and body weights • SLR with transformed data • Transforming X, quadratic fit • Other options Diploma in Statistics Introduction to Regression
Optimising a nicotine extraction process In determining the quantity of nicotine in different samples of tobacco, temperature is a key variable in optimising the extraction process. A study of this phenomenon involving analysis of 18 samples produced these data. Diploma in Statistics Introduction to Regression