Download
1 / 18
190 likes | 215 Vues
This lecture reviews indicator variables, mammal analysis, course outline, and examination content for the 2008 Diploma in Statistics. It covers topics such as ANOVA, regression analysis, recovery method comparisons, and more. Special topics include multiple regression analysis, non-linear relationships, and interpreting regression results. There is also a case study on public-private wage differentials in Ireland. Additional content includes advice on analyzing data, serial correlation caution, and trend analysis. Good luck with your studies!

E N D
Introduction to RegressionLecture 6.2 • Review of indicator variables • More on mammals • Review of course • Annual Examination, 2008 Diploma in Statistics Introduction to Regression
Review of indicator variables 2-sample t as One-way ANOVA as Regression on sample indicator Diploma in Statistics Introduction to Regression
Two-sample T for Recovery Method N Mean StDev SE Mean A 12 95.39 1.11 0.32 B 12 96.82 1.25 0.36 Difference = mu (A) - mu (B) Estimate for difference: -1.425 95% CI for difference: (-2.423, -0.427) T-Test of difference = 0 (vs not =): T-Value = -2.96 P-Value = 0.007 DF = 22 Both use Pooled StDev = 1.1787 Diploma in Statistics Introduction to Regression
One-way ANOVA:Recovery versus Method Source DF SS MS F P Method 1 12.18 12.18 8.77 0.007 Error 22 30.57 1.39 Total 23 42.75 S = 1.179 R-Sq = 28.50% R-Sq(adj) = 25.25% Level N Mean StDev A 12 95.392 1.106 B 12 96.817 1.247 Diploma in Statistics Introduction to Regression
Regression Analysis:Recovery versus Method_A Predictor Coef SE Coef T P Constant 96.8167 0.3403 284.53 0.000 Method_A -1.4250 0.4812 -2.96 0.007 S = 1.17871 Analysis of Variance Source DF SS MS F P Regression 1 12.184 12.184 8.77 0.007 Residual Error 22 30.566 1.389 Total 23 42.750 Diploma in Statistics Introduction to Regression
Regression Analysis:Recovery vs Method_A, Method_B Predictor Coef SE Coef T P Noconstant Method_A 95.3917 0.3403 280.35 0.000 Method_B 96.8167 0.3403 284.53 0.000 S = 1.17871 Analysis of Variance Source DF SS MS F P Regression 2 221676 110838 79776.69 0.000 Residual Error 22 31 1 Total 24 221707 Diploma in Statistics Introduction to Regression
More on mammals Diploma in Statistics Introduction to Regression
Mammal clusters? Diploma in Statistics Introduction to Regression
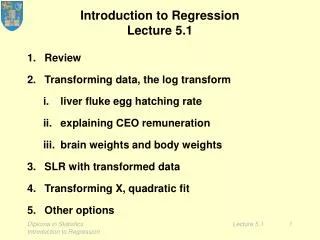
Course Outline Review of Simple Linear Regression • Initial analysis • Linear model • Prediction formula • Estimation and Testing • Correlation Non-linear relationships • the log transformation, • and others Diploma in Statistics Introduction to Regression
Course Outline Multiple regression analysis • Initial data analysis • Least squares fit and interpretation • Diagnostic analysis of residuals • Application Special topics • indicator variables • correlated explanatory variables • model selection Diploma in Statistics Introduction to Regression
Course Outline Issues in interpreting regression • "cause and effect" • control of study environment • observational studies vs controlled experiments Specialisations and extensions a list! Statistical computing laboratories Diploma in Statistics Introduction to Regression
Course Outline Case Study: Public-Private Wage Differentials in Ireland, 1994-2001 by G. Boyle, R. McElligott and J. O'Leary, ESRI Quarterly Economic Commentary, Summer 2004 http://www.esri.ie/UserFiles/publications/20070725110234/QEC2004Sum_SA_Boyle.pdf Diploma in Statistics Introduction to Regression
Serial correlation, a cautionary tale Analysis of a food commodity index Simple linear trend analysis: unexpected coefficients estimates Advice: draw a scatterplot Action: consult an econometrician, calculate Durbin-Watson test, significant, serial correlation Advice: draw a scatterplot Action: consult an econometrician, apply Cochrane-Orcutt method no help Advice: draw a scatterplot Diploma in Statistics Introduction to Regression
What the data looked like Diploma in Statistics Introduction to Regression
Annual Examination, 2008 Diploma in Statistics Introduction to Regression
Annual Examination, 2008 Diploma in Statistics Introduction to Regression
Annual Examination, 2008 Diploma in Statistics Introduction to Regression
Good luck! Diploma in Statistics Introduction to Regression