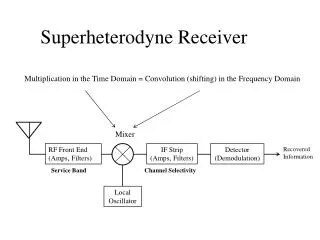
Superheterodyne Receiver
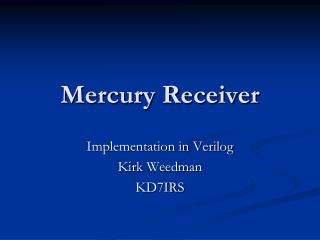
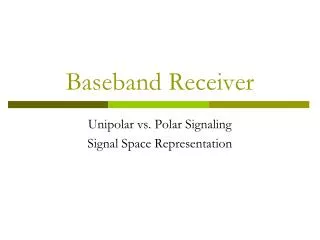
Multiplication in the Time Domain = Convolution (shifting) in the Frequency Domain. Superheterodyne Receiver. Mixer. RF Front End (Amps, Filters). IF Strip (Amps, Filters). Detector (Demodulation). Recovered Information. Service Band. Channel Selectivity. Local Oscillator. -w 1. w 1.

Superheterodyne Receiver
E N D
Presentation Transcript
Multiplication in the Time Domain = Convolution (shifting) in the Frequency Domain Superheterodyne Receiver Mixer RF Front End (Amps, Filters) IF Strip (Amps, Filters) Detector (Demodulation) Recovered Information Service Band Channel Selectivity Local Oscillator
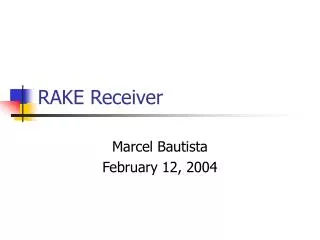
-w1 w1 Image Effect w3-w2 = w2-w1 Local Oscillator -w2 w2 -w3 w3 -w1-w2 w1-w2 -w1+w2 w1+w2 -w3-w2 -w3+w2 w3-w2 +w3+w2
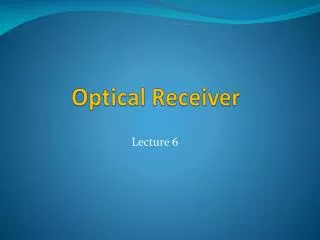
Image Effect (cont) Upper Conversion Band Lower Conversion Band Image Band Image Band Desired Channel Desired Channel BWIF fLO + fIF fIF fLO - fIF fLO Any signals entering the mixer in the Desired Channel and/or the Image Band will be converted down into the IF bandwidth, amplified, and demodulated. Low Side Injection High Side Injection • This includes: • Desired and interfering (image band) signals entering the antenna • kTB noise amplified by the RF amplifiers
Observations The desired channel and its image band are always separated by twice the IF frequency.. The LO frequency is always exactly between the desired channel and its image band, Upper Conversion Band Lower Conversion Band fLO + fIF fLO - fIF fLO
Observations (cont) The higher the IF frequency, the greater the frequency displacement between the desired channel and its image band. fLO + fIF fIF fLO - fIF fLO
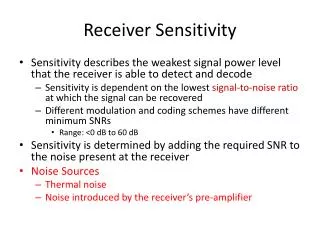
Observations (cont) Filtering (pre-selector) before the mixer, in the RF front end, can reduce the effects of image band signals and kTB noise. LO Range Pre-selector Response DS LO US Worst Case Image Rejection Image Rejection for DS Image Band Range Service Band Range
Pre-selector Math BWS : Pre-selector Passband ~ Service Band Range 2fIF 2fIF fs,MIN fs,MAX US DS DS US Image Rejection for DS Worst Case Image Rejection fc : Center of Service Band and Pre-selector pass-band Image Rejection Shape factor for Specific Channel DS: Worst Case Image Rejection Shape Factor (Low-side Injection) (High-side Injection)
Image Band Thermal Noise A pre-selector filter between the antenna and first RF amp limits all out of band interfering signals entering the receiver, including images. . . . . . But does not reduce thermal noise in the image band. Absent additional mitigation, this will allow thermal noise power equal to kT0B from both the image band and desired channel to enter the mixer and pass through the IF. This effectively doubles the noise bandwidth , and the effective noise power entering the receiver is 2kT0B, where B is the IF bandwidth. If a second pre-selector is included following the first RF amplifier, the amplified thermal noise in the image band can be reduced to well below the amplified on-channel thermal noise (which we can’t do anything about), effectively eliminating it, as well as providing additional image rejection. Mixer RF Amp RF Amp Pre-selector Pre-selector
Effect on Noise Figure When determining the noise figure/ratio of the receiver, structure and the placement of the pre-selector filters must be taken into consideration. If a pre-selector is included between the first RF amp and the mixer, there is no appreciable noise power contribution from the image band, and Friis’ formula will provide an accurate noise ratio. If there is no pre-selector between the first RF amp and the mixer, then the result of Friis’ formula must be doubled (add 3 dB to resultant noise figure) to account for the excess noise contribution from the image band.
Computing Image Rejection Determine the shape factors for the desired frequency and image frequency (mid-band or band edge) for all pre-selectors (they may have different bandwidths). Based on the poles/ripple of each pre-selector, determine the attenuations corresponding to the shape factors determined in step 1. The image rejection for each filter is the difference between the attenuation for the image and the attenuation for the desired frequency. The total image rejection in dB is the sum of the image rejections in dB as determined in step 3.
Example Service Band: 118 – 124 Mhz IF: 9.4 Mhz, Low Side Injection Mixer RF Amp RF Amp Pre-selector A Pre-selector B Pre-selector A: fc = 121 Mhz, BW3dB =8 Mhz 2 Poles, 0 dB ripple Pre-selector B: fc = 121 Mhz, BW3dB = 7.5 Mhz 3 Poles, 0.1 dB ripple QU = 80 BW3dB Image Band BWS : 6 Mhz 18.8 Mhz DS: 124 Mhz US: 105.3 Mhz Worst Case Image Rejection fc : 121 Mhz
Worst case Image Frequency: 124Mhz – 2(9.4 Mhz) = 105.3 Mhz (FM Broadcast) Total Worst Case Image Rejection Ratio = 66.5 dB