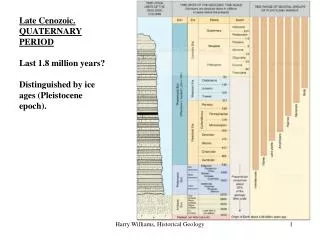
Pleistocene Ice Ages
920 likes | 2.11k Vues
Pleistocene Ice Ages. A Glacial World 21,000 yrs ago. Insolation Levels Were the Same As Today. This seemingly contradiction can be explained Slow response to low summer insolation When the ice reached maximum size, summer insolation had risen to close to today’s Would soon melt the ice

Pleistocene Ice Ages
E N D
Presentation Transcript
Insolation Levels Were the Same As Today • This seemingly contradiction can be explained • Slow response to low summer insolation • When the ice reached maximum size, summer insolation had risen to close to today’s • Would soon melt the ice • Insolation can’t have been a major factor in causing the glacial climate • So, what are the factors? • The Larger ice sheets themselves provided negative feedback • Lower greenhouse gases
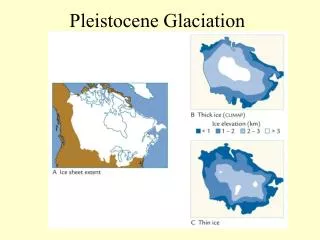
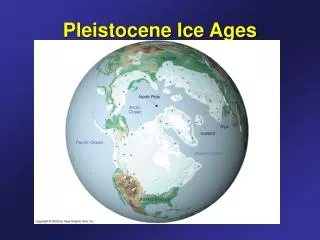
Ice Ages in North America Continental Glaciers advanced & Receded at least 4 times during past 2 million years During glacial advances, sea level drops exposing continental shelf Maximum advance of last glacier 18,000 yrs ago Sea level rises 300 ft by 8,000 yrs, resulting in present coastline
Ice Sheets in Europe • Scandinavian Ice Sheet • Northern Europe • Barents ice Sheet • Northern Eurasian continental shelf
Thickness of the North American Ice Sheet • Two Estimates • Thicker ice • CLIMAP (Climate Mapping and Prediction) Project – an interdisciplinary effort to reconstruct past climate begun in the 1970’s • Thinner ice from recent reconstructions
Estimating the Ice Sheet’s Thickness • The weight of the ice sheet causes the underlying bedrock to subside. • 30% of its thickness • The height of the ice sheet above the surrounding landscape is usually 70% of its total thickness.
Crustal Rebound • As a result of a slow viscous response • Bedrock rebound occurs long after the ice melts. • As the land slowly rises out of the sea, a trail of fossil beach shorelines are formed. • Rate of rebound can be estimated • 14C fossil shells dated • Measure elevations of old shorelines above sea level.
Changes in Sea Level • The thicker the ice, the greater the drop in sea level. • CLIMAP reconstructions require at least a 129 m drop • Recent measurements from submerged coral reefs indicate a drop of 110 m • Not enough for the thickness of the ice in the CLIMAP estimate.
Glacial Dirt and Winds • Ice sheets and mountain glaciers eroded huge amounts of debris and carried it to their margins • Silt-sized loess was deposited downwind. • Mostly from the west-northwest to the east-southeast in both N. America and Europe • Clay-sized loess • Glacial age layers in Greenland ice sheet contain 10X as much fine dust as interglacial layers • Chemical analysis indicates that the main source was Asia, not nearby N. America.
Dust Transport at Lower Latitudes • Desert margins in Arabia, the southern Sahara, and Australia • Produced larger amounts of dust during the last glacial maximum • Probably resulted from • Greater production of debris at the source • A more turbulent atmosphere that carried dust farther and higher than today.
Sand Dunes • Moving Sand Dunes Today • Africa, Arabia, and Australia • Last Glacial Maximum • Drier climates and stronger winds • More extensive sand dunes
Summary of Landscapes Features Resulting from Continental Glaciation Unsorted (till)
Summary of Landscapes Features Resulting from Continental Glaciation Stratified (sorted and layered)
Fjiords Coastal inlets formed by drowning of glacially carved valleys by rising sea level
Retreat of the North American Ice Sheets Numbers indicate 14C-dated Ice limits in 1000’s of years • Radiocarbon dating of organic remains in moraines • Retreat began about 14,000 14C years ago • Ice disappeared completely shortly after 6000 years ago
Causes of Climate Change During Deglaciation • Deglaciation 17,000 to 6,000 years ago • Rising Summer insolation • Increased CO2 Concentrations • Shrinking ice sheets had less ability to influence climate
Deglacial Rise in Sea Level • Rising sea level is indicated • by both dating methods • The 14C data support the • Milankovitch theory • - The middle of the deglaciation • occurred near the insolation • maximum 10,000 yrs ago. 14C ages are younger • Submerged corals off Barbados • Show the deglacial history of the eustatic rise in sea level • Caused by meltwater from the ice sheets into the ocean Which is correct?
Deglacial 14C Dates Are Too Young • Tree ring analysis • Dated both by: • 14C method • Counting backward year from modern rings to older rings • Ages were older than the 14C analysis by 1000 years • Same amount by which the Th/U coral ages were offset from the 14C coral ages • 14C error is due to varying rates of 14C atom production in the past
Radiocarbon Dating • Rates of cosmic bombardment were higher in the past • Earth’s magnetic field was weaker • Other elements that are the product of cosmic bombardment were more abundant • Paleomagnetic data from rocks supports this • More 14C atoms were produced • Surviving excess of 14C atoms makes it look like less has decayed • Seems younger
Meltwater Pulses • Influx of meltwater • Low δ18O values from the Norwegian Sea and Gulf of Mexico • Seen in CaCO3 shells of ocean planktonic foraminifera • 17,000 to 14,500 years ago • Rapid rise in sea level
Routes of Meltwater Flow • Direction of drainage changed • Southward to the Gulf of Mexico early in the deglaciation • Then, briefly east to the Atlantic Ocean • Finally, north into Hudson Bay and the Arctic Ocean late in the deglaciation
Interruption on the Deglacial Warming,The Younger Dryas • A pause in the melting accompanied by a brief climatic oscillation • First evidence • Pollen in Europe • As the ice sheet melted back to the north scattered trees reoccupied northern Europe • Near 15,000 years ago • Cold-tolerant herb tundra reinvaded the landscape, displacing trees toward southern Europe • An Arctic plant called Dryas arrived • Cause (?) • Possible change in meltwater flow from the North American ice sheet • Delivered a pulse of low salinity water that rearranged the basic circulation of the North Atlantic
The Younger Dryas Cold Reversal • Readvance of polar water in the North Atlantic (A) • Reversal toward Arctic vegetation in Europe (B) • Return to cooler temperatures • Indicated by fossil insect populations in Britain
A Recently Published Theory • Widespread extinctions of herbivorous megafauna in North & South America • Between 13,000 and 12,000 years ago • Methane loss of about 9.6 trillion grams per year • Explains between 12.5 and 100 percent of the methane decrease • May have triggered Earth’s global cooling
Proglacial Lakes • As ice sheets melt back • Land directly in front remains depressed for some time • Meltwater pours into these depressions, forming proglacial lakes. • Large volumes of meltwater each summer often • Cut new channels • Overflow into other lakes and into rivers, carrying water away from the ice sheets
Glacial Lake Agassiz • In western Canada • Existed for several thousand years • Flooded a total of more than 500,000 km2 • Smaller areas were flooded as the glacier retreated, eventually resulting in Lake Agassiz • Covered more than 200,000 km2 • Depth of 100 meters or more
Channeled Scablands • Massive erosion in east-central Washington State • Ancient lava flows eroded • Into deep canyons • Dry channels abruptly plunge over steep cliffs into larger channels • Suggests violent action of water on an immense scale • Huge boulders and displaced gravel and sand lie in channels
A Flood of Immense Proportions • In a few days • Carried a volume of water equivalent to all of Earth’s rivers today • Flowed wildly over the landscape • Gouged and eroded the lower terrain • Left the higher areas untouched • Eventually flowed down the Columbia River and into the Pacific Ocean • Source: Likely proglacial Lake Missoula • Cause • Possibly a volcano beneath the ice margin caused rapid melting and the sudden release of the enormous torrent of water
Deglacial Flooding of Coastlines • Many regions were exposed during low sea level during the glacial maximum • Submerged during deglaciation (returned 44 million km3 of meltwater to the oceans)
Retreat of the Wisconsinan Glacier • Stages D, E, and F occurred 11,000 to 12,000 years ago • The final stage was approximately 11,000 years ago
Continental Glaciers Retreat forming Long Island of Today • Lakes form as ice sheet melts • Sea Level Rises • LI Sound fills with water from Ocean • LI takes modern form • (from Newsday “Long Island Our Story”
Topography of Long Island North Shore: Irregular Coast & Hilly South Shore: Straight Coast & Flat Digital Elevation Model: 2X Vertical Exaggeration (Bennington, 2003) Data from NYSDEC & Cornell University
Glacial Features of LI Lake Ronkonkoma Harbor Hill Moraine Ronkonkoma Moraine Outwash Plain Kames
Glacial Till Unsorted Sediments were deposited directly by ice. Round shape of many boulders indicates that they were also shaped by running water Eroding moraine at Montauk Boulders at Orient
Glacial Features of Smithtown & Central LI Harbor Hill Moraine Ronkonkoma Moraine Lake Ronkonkoma Outwash Plain
Harbor Hill Moraine Closeup view of Till of Harbor Hill Moraine consisting of unsorted silt, sand, pebbles, and cobbles Till of Harbor Hill Moraine overlying outwash deposits (RTE 25 A, Setauket)
Kame Deltas indicate large pro-glacial lakes as continental glacier melted Harbor Hill Moraine Kame Deltas Ronkonkoma Moraine Outwash Plain Note: Kame Deltas overlie Ronkonkoma Moraine What does this indicate about the relative age of the Deltas?