Download
1 / 46
620 likes | 2.76k Vues
A Brief Overview of Hemoglobin Electrophoresis . Sarah Walter, M.D. Normal Hemoglobin Structure. Hemoglobin A is a tetramer composed of 4 subunits: 2 α and 2 β Each subunit has a porphyrin ring which holds an iron molecule. This is the binding site of oxygen. Normal Hemoglobin Structure.

E N D
A Brief Overview of Hemoglobin Electrophoresis Sarah Walter, M.D.
Normal Hemoglobin Structure • Hemoglobin A is a tetramer composed of 4 subunits: • 2α and 2β • Each subunit has a porphyrin ring which holds an iron molecule. • This is the binding site of oxygen
Normal Hemoglobin Structure Hemoglobin tetramer
Normal Hemoglobin Structure O O Fe Porphyrin ring O2 binding site The oxygen atom binds to the Fe atom perpendicular to the porphyrin ring
Hemoglobin Function • The function of the Hemoglobin molecule is to pick up oxygen in the lung and deliver it to the tissues utilizing none of the oxygen along the way.
Hemoglobin Function • The normal hemoglobin molecule is well suited for its function • Allows for O2 to be picked up at high O2 tension in the lung and delivered to the tissues at low O2 tension. • The oxygen binding is cooperative: • As each O2 binds to hemoglobin, the molecule undergoes a conformational change increasing the O2 affinity for the remaining subunits. • This creates the sigmoidal oxygen dissociation curve
Normal Hemoglobin Function The hemoglobin dissociation curve
Normal Hemoglobin Function • Many variables influence the dissociation curve: • pH: • An increase in pH (dec. CO2) shifts the curve to the left (increased O2) affinity • A decrease in pH (inc. CO2) shifts the curve to the right (decreased O2 ) affinity • Temperature: • Increased temp with increased metabolic demands causes decreased O2 affinity (right shift) and increased O2 delivery • 2,3 DPG: • Lowers O2 affinity by preferentially binding to Beta chain of deoxyhemoglobin, stabilizing it and reduces the intracellular pH • As hemoglobin concentration decreases, 2,3 DPG increases, allowing more O2 to be unloaded
Other Hemoglobins in normal adults * Indicates early embryonic form not seen in adults
Other Hemoglobins in normal adults • HbA2: • Decreased in iron deficiency, alpha-thalassemia • Elevated in megaloblastic anemia, hyperthyroidism, Beta-thalessemia • HbF: • Elevated in HPFH, Sickle cell anemia (preferential survival of RBCs because HgF inhibits sickling), Beta thalessemia major • Normal levels in Beta-thalassemia minor • Normal or mildly elevated in congenital hemolytic anemia • Marked elevation in juvenile CML (up to 70%)
Hemoglobin Abnormalities • There are 3 main categories of inherited Hemoglobin abnormalities: • Structural or qualitative: The amino acid sequence is altered because of incorrect DNA code (Hemoglobinopathy). • Quantitative: Production of one or more globin chains is reduced or absent (Thalassemia). • Hereditary persistence of Fetal Hemoglobin (HPFH): Complete or partial failure of γglobin to switch to β globin.
Abnormal Hemoglobin • Reasons to suspect a hemoglobin disorder: • Patient presents with suspicious history or physical exam • Laboratory tests: Microcytic hypochromic RBCs, hemolytic anemia • Screening test abnormality (primarily in neonates)
Laboratory Methods to evaluate Hemoglobin • Red cell morphologies: • HbS: Sickle cells
Laboratory Methods to evaluate Hemoglobin • Red cell morphologies: • HbS: Sickle cells • HbC: Target cells, crystals after splenectomy
Laboratory Methods to evaluate Hemoglobin • Red cell morphologies: • HbS: Sickle cells • HbC: Target cells, crystals after splenectomy • Thalassemias: Microcystosis, target cells, basophilic stippling
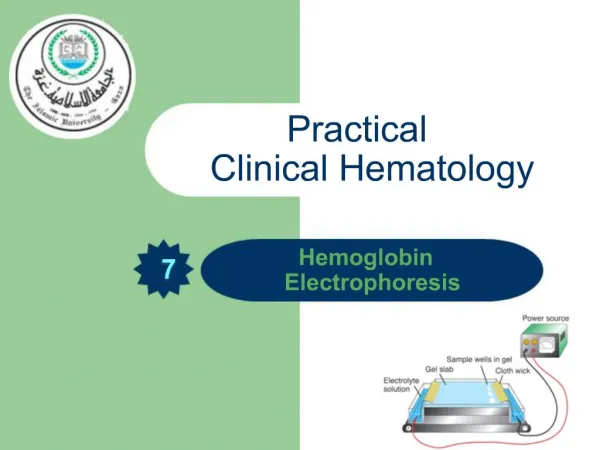
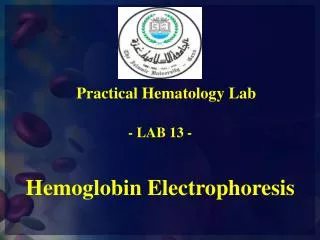
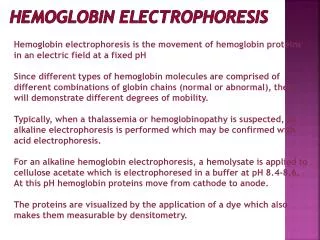
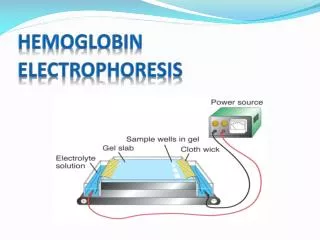
Laboratory Methods to evaluate Hemoglobin • Electrophoresis: • Alkaline (Cellulose Acetate) pH 8.6: • All Hemoglobin molecules have a negative charge, and migrate towards the anode proportional to their net negative charge. • Amino acid substitutions in hemoglobin variants alter net charge and mobility. • Acid (Citrate agar) pH 6.2: • Hemoglobin molecules separate based on charge differences and their ability to combine with the agar. • Used to differentiate Hemoglobin variants that migrate together on the cellulose gel (i.e. HbS from HbD and HbG, HbC from HbE).
Laboratory Methods to evaluate Hemoglobin • High-Performance Liquid Chromatography (HPLC): • Weak cation exchange column. The ionic strength of the eluting solution is gradually increased and causes the various Hemoglobin molecules to have a particular retention time. • Amino acid substitutions will alter the retention time relative to HbA. • There is some analogy between retention time and pattern on alkaline electrophoresis.
Laboratory Methods to evaluate Hemoglobin • Solubility test (Sickledex): • Test to identify HbS. HbS is relatively insoluble compared to other Hemoglobins. • Add reducing agent • HbS will precipitate forming and opaque solution compared with the clear pink solution seen in HbS is not present.
Most common Hemoglobin abnormalities • Thalassemias • Alpha • Beta • Hemoglobinopathies • HbS trait; disease • HbC trait; disease • HbE • Hereditary Persistence of Hemoglobin F (HPHF)
47 year old female presents with a history of peptic ulcer disease, H. Pylori an anemia. Labs: Hgb: 10.2 Hct: 30.9 MCV: 96.4 B12: 338 Iron: 122 Ferritin: 304.5 IBC: 226 Case 1
Case 1 HbF: 1.3% HbA2: 4.1% Sickledex test POSITIVE
Case 1 • Hemoglobin S/C disease: • Second most common hemoglobin variant in Africans; 1 in 1000 births of African Americans • Relatively benign condition; Milder disease than Sickle cell disease. Patients have normal growth and development • Do not see the classic sickle cells • Peripheral smear reveals anisocytosis, target cells, poikilocytosis, polychromasia
Case 1 • Hemoglobin S/C disease: • Most patients have moderate splenomegaly with many having autosplenectomy, usually older age than with Sickle cell disease • May have veno-occlusive disease, but less common and less severe than in sickle cell disease • May have aseptic necrosis of bone with osteomyelitis • ~50% HbS: 50% HbC; rarely is HbF >2%
A 45 year old German man who is asymptomatic is seen for microcytosis. Peripheral smear shows microcytosis, hypochromia, target cells, basophilic stippling, polychromasia Labs: Hgb: 11.8 Hct: 37.5 MCV: 65.9 Iron: 119 Ferritin: 506 IBC: 275 Fe Sat: 43% Case 2
Case 2 HbF: 1.6%* HbA2: 5.1%
Case 2 Cellulose acetate gel performed HbS HbS
Case 2 • Beta Thalassemia Minor: • The thalassemia seen most commonly is caucasians (primarily Mediterranean descent) • Beta thalassemia minor is loss of one of two genes for Beta globin on chromosome 11 • Patients generally asymptomatic • May have mild microcytic anemia (MCV: 60-70; Hgb: 10-13) with a normal or slightly increased RBC count • The peripheral smear will show target cells and basophilic stippling • See increased HbA2 in the range of 5-9% with normal HbF • Thalassemia found most commonly in caucasians • See mild microcytosis
Case 2 • Beta Thalassemia Minor: • Primary indication is a slightly elevated HbA2 detected by HPLC (usually around 4-7%, up to 10%) typically without elevation of HbF • Diagnosis may be obscured in concomitant iron deficiency present because Beta-thalassemia causes an increase in HbA2 while iron deficiency causes a decrease in HbA2. Both create a microcytosis. • May see a anemia that partially responds to iron therapy • Always want to look at iron studies when interpreting hemoglobin electrophoresis; usually wait to diagnose until nutritional deficiencies have first been corrected.
Case 2 • Beta Thalassemia Major: • Homozygous double gene deletion with no Beta globin production • Presents with lethal anemia, jaundice, splenomegaly, growth retardation, bone malformations, death • Severe hypochromic, microcytic anemia with very bizarre cells • HbA2 is not increased • HgF is at nearly 100% • Abundant intra-erythrocyte precipitation of alpha monomers that are insoluble
47 year old African American female presents to the ER with drug intoxication and marked anemia. She is unable to provide any adequate history to the clinicians. Labs: Hgb: 5.9 Hct: 17.8MCV: 97.1 RDW: 20.9 Iron: 83 Ferritin: 394.3 IBC: 144 Fe Sat: 58% Case 3
Case 3 HbF: 1.0%; HbA: 38.7%; HbA2: 4.4%; HbS: 56.1% Sickledex is POSITIVE; Peripheral smear with 2+ sickle cells
Case 3 • Sickle cell anemia: • In sickle cell trait, usually see HbS concentrations of 35 to 45% of total Hemoglobin because the HbS has a slower rate of synthesis than HbA • If HbS is less than 33%, start thinking about S-alpha-thalassemia • If HbS is greater than 50%, worry about S-Beta-thalassemia or Sickle cell disease with transfusion
Case 3 • Sickle cell anemia: • This patient was transfused with two units of RBCs before the HPLC was performed. • It is important to know the appropriate ratios of HbS: HbA expected. If the patient does not fit, always look at the transfusion history. • If concerned about overlying Beta-thalassemia, repeat HPLC after four months of most recent transfusion
Case 3 Expected ratios
31 year old healthy female, pregnant with moderate target cells detected on routine peripheral smear Labs: Hgb: 15.0 Hct: 42.5 MCV: 87.8 MCH: 31.0 RDW: 12.6 Case 4
Case 4 HbF: 0.6%; HbA2: 2.9%; HbA: 56.3%
Case 4 • Hemoglobin C trait: • Hemoglobin C trait (Heterozygotes) are clinically and hematologically well • Moderate target cells seen on peripheral smear • HbA and HbC in a 60:40 ratio on HPLC • 2% of African Americans have HbC trait • Homozygotes have mild hemolytic disease, cholelithiasis and occasional aplastic crisis. • See reduced MCV with increased MCHC • Intracellular HbC crystals, block-like structures may be seen and are pathognomonic of HbC.