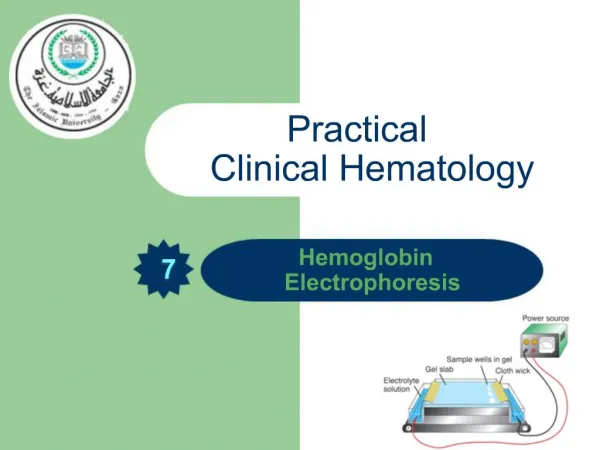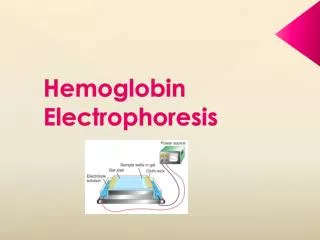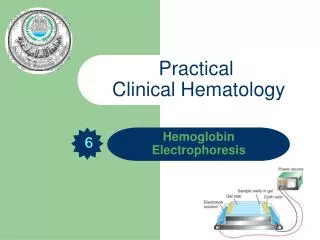
Hemoglobin Electrophoresis
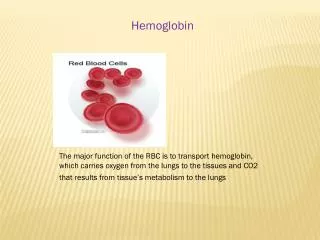
Hemoglobin Electrophoresis. Dr Nisha S Ahmad Chief of Lab Services Metropolis Health Services. Agenda. Brief overview of hemoglobin The globin genes The Thalassemias Structural hemoglobinopathies Testing. Hemoglobin. 4 Heme groups 4 polypeptide chains. Hemoglobin structure. A. B.


Hemoglobin Electrophoresis
E N D
Presentation Transcript
Hemoglobin Electrophoresis Dr Nisha S Ahmad Chief of Lab Services Metropolis Health Services
Agenda • Brief overview of hemoglobin • The globin genes • The Thalassemias • Structural hemoglobinopathies • Testing
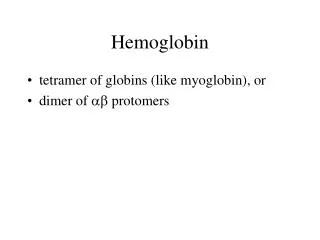
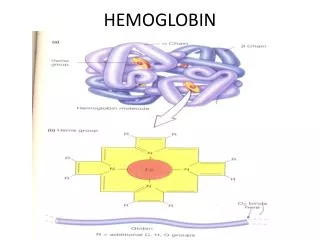
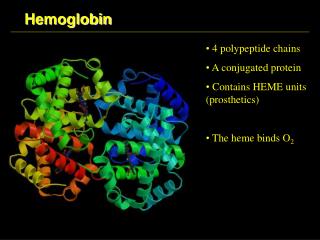
Hemoglobin • 4 Heme groups • 4 polypeptide chains
Hemoglobin structure A B B A heme
Hemoglobins in normal adults A B A G A D B A G A D A HbA HbF HbA2 95-98% ~1% <3.5%
Hemoglobinopathy An inherited mutation of the globin genes leading to a quantitative or qualitative abnormality of globin synthesis
Thalassemia - Defined • A family of genetic anemias characterized by a reduced rate of production of 1 or more globin subunits of hemoglobin (Hb) • Symptoms are caused by the deleterious effects of the normally produced subunits that are now in excess
Pathophysiology • Excess alpha chains precipitate and form inclusion bodies that associate with the RBC cell membrane • Cause membrane damage and shortened cell survival • Large scale destruction of precursor cells in bone marrow • Decreased B production causes increased δ production and an elevated A2 (α2δ2)
Types of B-globin mutations • B0 – No B-globin chains are produced • B+ - some beta chains produced Decreased
Alpha Thalassemia Deletions of alpha- globin gene (s) Symptoms can begin in fetal life Complicated inheritance – 4 alpha genes Beta Thalassemia Nonsense, splice and frameshift mutations in beta-globin gene Symptoms begin in infancy/childhood Simple AR inheritance; genotype-phenotype correlation α- and β-thalassemia
Structural variant - Defined • Abnormal globin protein that is produced at a normal rate, with varying consequences • Oxygen affinity, stability and function
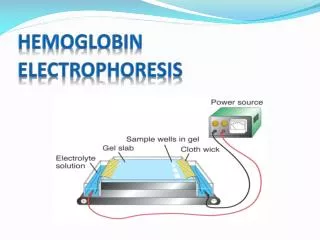
Laboratory Investigation CBC-MCV,MCH,RDW Tests Hemoglobin electrophoresis • Cellulose acetate: Alkaline pH • Citrate agar: Acid pH • Capillary Electrophoresis HPLC IEF DNA
Preanalytical • EDTA sample • Age • H/O Transfusion • Area of Residence E/D/C
SCREENING ANTENATAL PROFILE HbA1c ANEMIA PROFILE PRE MARITAL NEONATAL PROFILE
Cellulose Acetate • pH-8.6 • In a alkaline solution ,Hb molecules have a net negative charge and move towards the anode
Cellulose Acetate Hb Electrophoresis - A2 F A + C/E/OS/D/G NORMAL BTT
Cellulose Acetate Hb Electrophoresis - A2/C S F A+ Normal Hb AS Hb SS
Cellulose Acetate Hb Electrophoresis - A2/C/E S /D F A+ Normal Hb AS HB AD
Citrate Agar Electrophoresis • pH-6.4 • Citrate agar electrophoresis at an acid Ph provides ready separation of hemoglobins that migrate together on cellulose acetate • S from D and G • C from E and O
Citrate Agar Hb Electrophoresis + C S A F _ Normal
Citrate Agar Hb Electrophoresis + C S A F _ Normal Sickle trait
HPLC • Separation based on interaction between Stationary Phase & Mobile Phase • Stationary Phase is Analytical Cartridge; Mobile Phase is Buffer • Compounds are separated to target analytes according to physical properties: - size, shape, charge, hydrophobicity & affinity for other molecules • Bound analytes elute off the stationary phase by manipulating the mobile phase
Contd… • Charged particles (matrix) bind reversibly to sample molecules (proteins, etc.) • Desorption is then brought about by increasing the salt concentration or by altering the pH of the mobile phase
HPLC Automated system;precalibrated column and gradient
Detector Direction of flow Stationary Phase: Cation Exchange Cartridge Carboxyl groups attached to a resin base
Hemoglobin Introduction Positively charged hemoglobin fragments in the hemolysate attach to the carboxyl groups at varying strengths.
Starting Gradient: Low Ionic Strength Buffer • The gradient starts with a low % of Buffer B (high % Buffer A) • At this gradient, hemoglobin fragments with an ionic strength lower than the buffer gradient, such as A and F, are displaced from the cartridge and pass into the detector
Ending Gradient: High Ionic Strength Buffer • As the % of the High Ionic Strength Buffer B increases, the more hemoglobin fragments will be displaced • Once the gradient is 100% Buffer B all remaining hemoglobin fragments, including any variant hemoglobins such as S, D and C, will be removed
Output Time CHROMATOGRAMS Peak Area RT
Normal HPLC Graph HbA F A2
Hb C Hb H HbF HbS Hb J Hb Köln HbE Hb O HbD Hb Q
Hb F 1.Delta beta Thal Trait 2.HPFH+IDA 1.Iron Studies 2.DNA Analysis
HPLC GRAPH OF CHILD Hb F= 100% Hb A2= 0% HbA0 =0% CBC: Hb = 6.8 g/dl MCV = 67.3 Fl MCH = 21.3 pg RDW = 24.7%