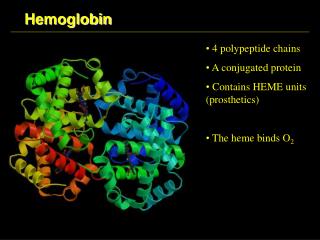
Hemoglobin Electrophoresis
Hemoglobin Electrophoresis . Hemoglobin electrophoresis is the movement of hemoglobin proteins in an electric field at a fixed pH

Hemoglobin Electrophoresis
E N D
Presentation Transcript
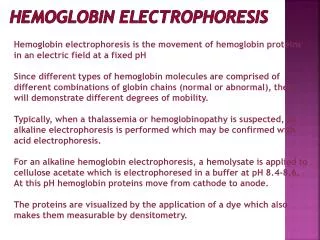
Hemoglobin Electrophoresis Hemoglobin electrophoresis is the movement of hemoglobin proteins in an electric field at a fixed pH Since different types of hemoglobin molecules are comprised of different combinations of globin chains (normal or abnormal), they will demonstrate different degrees of mobility. Typically, when a thalassemia or hemoglobinopathy is suspected, an alkaline electrophoresis is performed which may be confirmed with acid electrophoresis. For an alkaline hemoglobin electrophoresis, a hemolysate is applied to cellulose acetate which is electrophoresed in a buffer at pH 8.4-8.6. At this pH hemoglobin proteins move from cathode to anode. The proteins are visualized by the application of a dye which also makes them measurable by densitometry.
Hemoglobin electrophoresis • Cellulose acetate at alkaline pH: initial procedure. • Separation is largely determined by electrical charge. • At this pH: Hb is negatively charged and moves toward the positively charged anode.
Hemoglobin electrophoresis Very small samples of hemolysates prepared from whole blood are applied to the Cellulose Acetate Plate. The hemoglobins in the sample are separated by electrophoresis using an alkaline buffer (pH 8.2-8.6), and are stained with Ponceau’S Stain. The patterns are scanned on a scanning densitometer, and the relative percent of each band determined.
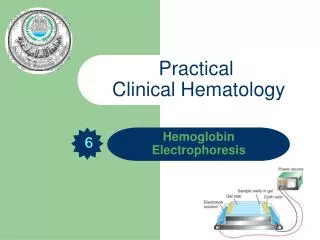
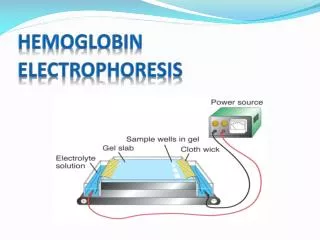
Hb Electrophoresis Tissue extracts are introduced into a solid support medium (a gel) in the sample wells at the Origin on the right-hand side of the gel. An electrical field is applied: many proteins have a net negative charge and will migrate from the Origin at the cathode end towards the anode end of the field. The positions of the protein products are detected either directly by staining, or by coupled enzymatic reactions.
Migration of Hemoglobin in Alkaline Electrophoresis • Of normal hemoglobins in an adult, Hb A is the fastest, followed by Hb F. • Hb A2 moves only slightly from the point of origin near the cathode. • Abnormal hemoglobins show the following migration patterns: Hb C migrates with Hb A2 near the cathode. • Hb S lies between hemoglobin A2 and Hemoglobin F. • Hb H and Bart's are unstable and very fast moving placing them past Hb A and near the anode with Hb H being the fastest of the two.
H AF S A2 Bart’s C
- + slight amount of hemoglobin A2, mostly hemoglobin A Near equal amounts of hemoglobin C and hemoglobin A Hemoglobin A and hemoglobin H Hemoglobin A2, hemoglobin S and hemoglobin A Control specimen hemoglobin F and hemoglobin A Control specimen hemoglobin C, hemoglobin S and hemoglobin A
Hemoglobin alkaline electrophoresis on this patient's sample is • pictured. Which hemoglobin bands are present? • Please select the single best answer ?
A band in the area of Hemoglobin H (Hb H). Hb H travels quickly during alkaline electrophoresis, and a shorter electrophoresis time was needed to ensure that Hb H remained on the acetate paper.Hb F is still present as it was on the original electrophoresis, but it is blended into the Hb A band.
The Hb electrophoresis demonstrated a normal pattern, initially, but the unstable Hemoglobin H was revealed upon repeat electrophoresis with reduced incubation time.
- control hemoglobin A-A2 • - control hemoglobin A, F, S, C • - normal • - our patient • - normal • - hemoglobin C trait (Hb AC) • - normal • - normal • - hemoglobin S trait (Hb AS) • Normal • Our patient : SC
** In what order do normal and abnormal hemoglobins migrate in alkaline electrophoresis (from cathode to anode)? • S with C, A, H, F, A2 • A2, S with C, H, F, A • C with A2, S, F, A, H • C with A2, F, S, A, H • C with A2, F, S, A, H
Chronic normocyticnormochromic anemia in the range of 8 to 10 g/dl. Further testing included Iron, TIBC, folate and B12 which were within normal range. Reticulocyte count was increased. Peripheral blood smear showed many target cells, nRBC and polychromasia.
The results of Hb electrophoresis performed on alkaline gel (1: normal, 2: AFSC control, 3: patient). Can you make a definite diagnosis? What do you do next?
Hb electrophoresis performed on acidic gel ( 1: normal, 2: AFSC control, 3: patient). Can you make a definite diagnosis now? Which band does not match the diagnosis? What other piece of clinical information you need to know?