Reduce Distribution System Pressure
Reduce Distribution System Pressure. Lessons Learned from Natural Gas STAR Distribution Technology Transfer Teleconference American Gas Association, Southern Gas Association, Northeast Gas Association, Ohio Gas Association, Texas Gas Association, Western Energy Institute, and


Reduce Distribution System Pressure
E N D
Presentation Transcript
Reduce Distribution System Pressure Lessons Learned from Natural Gas STAR Distribution Technology Transfer Teleconference American Gas Association, Southern Gas Association, Northeast Gas Association, Ohio Gas Association, Texas Gas Association, Western Energy Institute, and EPA’s Natural Gas STAR Program May 17, 2005
EPA Natural Gas STAR • The Natural Gas STAR Program is a flexible, voluntary partnership between EPA and the oil and natural gas industry designed to cost-effectively reduce methane emissions from natural gas operations • 338 Bcf methane savings since 1993 • 49 AGA members have partnered with Natural Gas STAR • 26 SGA members have partnered with Natural Gas STAR • AGA and SGA members report savings of over 123 Bcf ($371 million) gas since 1993
U.S. Industry Participation • 117 Program Partners • 62% of transmission • 26 partners • 60% of distribution • 48 partners • 51% of production • 32 partners • 63% of processing • 12 partners
Reduce Distribution System Pressure: Agenda • Part 1: Problem Description • Methane Losses • Methane Recovery • Discussion Questions • Part 2: Is Methane Recovery Profitable? • Savings • Costs • Economics • Discussion Questions • Part 3: Industry Experience
Distribution Sector Methane Losses • Distribution sector is 19% of natural gas and oil methane emissions Emissions Oil Downstream 2 Bcf 1 Bcf Reductions Processing 36 Bcf Production 148 Bcf 7 Bcf Distribution 68 Bcf 24 Bcf Inventory of US Greenhouse Gas Emissions and Sinks 1990 - 2003 Transmission & Storage 101 Bcf 18 Bcf
Methane Losses by Source • Nearly all distribution sector methane losses are unintended fugitive leaks Protected Steel Mains/Services 3 Bcf Other Sources 2 Bcf M&R Stations 17 Bcf Customer Meter Leaks 6 Bcf Plastic Mains/Services 8 Bcf Cast Iron Mains 8 Bcf Unprotected Steel Mains/Services 13 Bcf Regulator Stations 11 Bcf
What is the Problem? • Fugitive leaks • Lead to higher maintenance costs • Cause product loss • Peak demand pressures are set for extended periods, but necessary only a small fraction of the time • Higher than necessary system pressure intensifies leakage • Increases maintenance costs and product loss • Increases “under-registered gas”
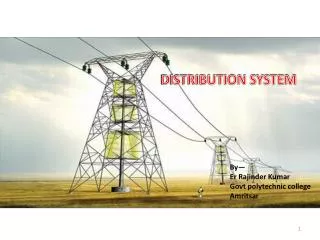
Distribution System Fugitive Sources • Facilities • Gate Stations: Reduce pressure and meter gas from transmission lines • District Regulators: Further reduce pressure for customer use • Lines: • High Pressure Mains: Carry gas from gate stations to customer districts • Low Pressure Mains: Carry gas from district regulators to service lines • Services: Branch-off from high or low pressure mains to customer meter
Methane Recovery • Gas STAR Partners adjust system pressures for shorter intervals to better match current demand • Minimizes leaks and product loss • Reduces maintenance • Reduces under-registered gas
Methane Recovery • Two approaches to match pressure with demand • Manual, periodic pressure regulation • Change of procedures to adjust DR set points • Low capital cost, higher operating costs • Automatic, near real-time pressure regulation • Installation of control systems to adjust DR set points • High capital cost, lower operating cost
Manual Pressure Regulation • Adjust DR set-points more frequently during scheduled maintenance • Example: from annual to semi-annual • Example: from semi-annual to quarterly • Example: from quarterly to monthly adjustments • Partners sometimes change pressure in steps to avoid system shock or pressure oscillations
Automatic Pressure Regulation • Automatic regulation can adjust DRs multiple times per day, more closely matching real demand with the lowest necessary pressures • Leads to lowest leak rates, less maintenance, less under-registered gas • Multiple degrees of automation technology • Lowest cost: clocking and temperature solenoids • Medium cost: remote terminal unit control systems • Highest cost: centralized supervisory computer
AUTOMATION FEATURES Automatic Pressure RegulationAlternatives
Review of Part 1 • Methane emissions • Distribution systems and pressure regulation • Methods for matching pressure to demand Questions?