Understanding Tissue Contrast and Signal-to-Noise Ratio in Imaging
This overview discusses the intrinsic and secondary factors affecting tissue contrast in imaging, focusing on the role of tissue proton density and relaxation properties (T1 and T2). Emphasis is placed on how relative brightness helps discriminate between tissues, the significance of windowing in image contrast, and the impact of noise on visualization of low-contrast structures. Key factors that influence the signal-to-noise ratio (SNR), such as magnet strength, coil selection, and voxel size, are also explored to optimize imaging conditions for accurate diagnosis.

Understanding Tissue Contrast and Signal-to-Noise Ratio in Imaging
E N D
Presentation Transcript
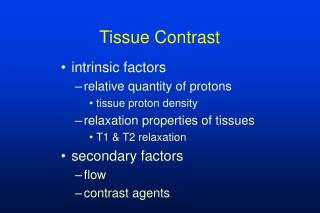
Tissue Contrast • intrinsic factors • relative quantity of protons • tissue proton density • relaxation properties of tissues • T1 & T2 relaxation • secondary factors • flow • contrast agents
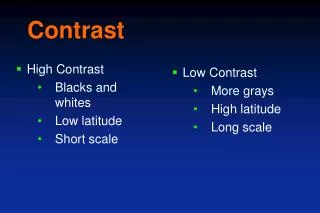
Contrast • the ability to discriminate different tissues based on their relative brightness
Basic Principle • relatively intermediate intensity structures look bright on a dark background • important to remember with fatsat • relatively intermediate intensity structures look dark on a light background
Caveat • windowing affects the relative contrast of tissues • intensity values of pixels are relative to one another, unlike CT • windowing can make a solid tumor look like a “cyst”
“CYST” T2 FSE T1 SE
CYST? T2 FSE T1 SE
CYST? T2 FSE T2 FSE
Summary • need visible differences in intensity to discriminate tissues • surrounding tissues can make an intermediate signal tissue appear dark or bright • windowing affects image and tissue contrast
Noise • constant at a given machine setup • reduces the ability to visualize low contrast structures • adds to or subtracts from the average signal intensity of a given pixel
Noise • increasing the available signal will reduce the relative effects of noise • machine parameters must be chosen to maximize signal without significantly extending exam times • S/N is a relative measure allowing for comparison in a variety of circumstances
high signal high SNR low signal low SNR SI SI frequency frequency Signal versus Noise
Image Contrast 100% noise
Image Contrast 80% noise
Image Contrast 60% noise
Image Contrast 40% noise
Image Contrast 20% noise
Image Contrast 0% noise
Factors Affecting SNR • strength of main magnet • coil selection • voxel size • phase encoding • number of averages • receiver bandwidth • pulse sequence parameters
Factors INCREASING SNR • stronger main magnet • proper imaging coil • larger voxel size • decreased phase encoding • increased number of averages • decreased receiver bandwidth • (pulse sequence parameters)
linear increase less T1 weighting at high fields increased chemical shift effects in RO direction Stronger Main MagnetS/N effect Downside
Coil SelectionS/N effect Downside • increase in signal with surface coils • quadrature provides 40% increase S/N over linear • phased array increased over quadrature • limited coverage with surface coils • more complex coils are more expensive
Larger Voxel SizeS/N effect Downside • linear increase in either RO or PE direction • linear increase with increased slice thickness • decreased resolution
Decreased Phase EncodingsS/N effect Downside • square root increase in signal to noise • linear decrease in scan time • decreased resolution in PE direction • Gibb’s phenomenon in PE direction
Increased Signal AveragesS/N effect Downside • square root increase in signal to noise • linear increase in scan time
Decreased Receiver BWS/N effect Downside • square root increase in signal to noise • increase in chemical shift artifact in RO direction
Pulse Sequence Parameters • SE imaging • increased TR provides nonlinear increase in SNR with linear increase in scan time • decreased TE provides nonlinear increase in SNR with no effect on scan time and less T2 weighting
Pulse Sequence Parameters • GE imaging • complex effects • maximum SNR typically between 30 and 60 degrees • long TR sequences (2D) • increase SNR with increased flip angle • short TR sequences (TOF & 3D) • decreased SNR with increased flip angle
SNR Application • pituitary imaging • baseline: • 16 cm FOV, 3 mm slice thickness, 192 phase encodes, 4 NEX • new goal: • reduced scan time, same SNR
Fat Suppression and SNR • non fat-suppressed image • each image pixel comprised of signal from water and fat in the imaging voxel • fat-suppression • reduces total signal by suppression of fat from the voxel • reduces SNR
without fat suppresion high SNR with fat suppression lower SNR SI SI frequency frequency Fat Suppression water plus fat water only