Download

1 / 27
270 likes | 515 Vues
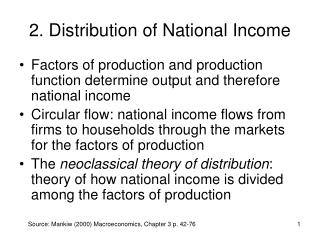
Chapter 12 The Distribution of Income. The Lorenz Curve. The Lorenz Curve measures income distribution by ranking individuals by income and then plotting their cumulative number against the cumulative percentage of income received.

E N D
The Lorenz Curve • The Lorenz Curve measures income distribution by ranking individuals by income and then plotting their cumulative number against the cumulative percentage of income received. • A perfectly equal distribution of income would be 45 degree line. • The more unequal the distribution of income, the more “bowed” the Lorenz Curve becomes.
Distributive Justice • The productivity principle asserts that each person ought to receive the monetary equivalent of what they have produced individually from our human resources (labour) and our nonhuman resources (property).
Product Exhaustion • If any measure of productivity is to serve as a distributional principle, it must fulfill the product exhaustion criterion. • The product exhaustion criterion states that if owners of all resources receive what their resources produce, then the individual shares of the total product pie must sum to 1.
Product Exhaustion • Consider a firm in long-run equilibrium using 2 inputs to producing y* of output. • The value of the firm’s output (py*), is the sum of the firm’s input payments (w1z1*) + (w2z2*). • If, at the firm level, the product is just used up, the two must be equal. • Therefore: py*=w1z1*+w2z2*
Product Exhaustion • Re-writing gives: p=(w1z1*+w2z2*)/y=LAC(y*) • This equality follows from the price being equal to minimum average cost in long-run perfectly competitive equilibrium. • The product-exhaustion criteria is therefore satisfied in a competitive equilibrium.
The Redistributionist Principle • The redistribution principle is at odds with the productivity principle. • Redistributionists find significant economic inequalities unacceptable. • They argue that wealth and income in the real world should be redistributed from rich to poor.
Redistribution of Income • Regardless of why income distribution takes place, some methods are better than others. • Many of the schemes inevitable result in a conflict between equity and efficiency. • The challenge is to design economic institutions that achieve the desired distribution and minimize the resulting inefficiencies.
Minimum Wage Legislation • The real question regarding minimum wage legislations is, “do they help the working poor?” • Does it achieve the desired redistribution of income? • Are workers in the industry better-off? • Whose income falls to make up for the rise in minimum wage income? • Is inefficiency an invariable side effect?
Figure 12.2 Minimum-wage legislation in a competitive labour market
Minimum Wage Legislation • In a competitive market, inefficiency is a necessary by-product of an effective minimum wage law. • As labour services are no longer put to there most productive uses, either unemployment or underemployment will signal that inefficiency.
Figure 12.3 Minimum wage and a monopsonist’s marginal factor cost
Monopsonistic Labour Markets • Once a minimum wage is brought into a monopsony, the marginal factor cost will change. • From Figure 12.3, if the monopsonist hires an amount of labour less than z’, its marginal factor cost is w’. • If it hires beyond that point, its marginal factor cost is segment BC of its original marginal factor cost function because it can hire additional workers only at a wage rate higher than w’.
Minimum Wage and Monopsony • Does a minimum wage increase workers incomes? • Yes, if wage is not higher than w”’ some workers are better off and none worse off because: - At w* or below, it has no effect. - At above w* but below w’’’ workers hired before the introduction of the minimum wage will paid more and new workers will be hired at the new (minimum) wage. - If the rate is w”’, no new workers are hired, but existing workers will be paid more.
Minimum Wage Legislation • The attractiveness of minimum wage legislation depends upon whether labour markets are competitive or a monopsony. • Empirical evidence suggests that labour markets covered by minimum wage laws are competitive, and the laws are problematic. • Workers who remain employed are better off. Its is not clear at whose expense the gain is made (we do not know who pays). • By creating un/underemployment the legislation will hurt some people it was intended to help.
Figure 12.5: The Underemployment Equilibrium • Imposing the wage floor means that some workers are reallocated from sector 1 to sector 2 and as a result the wage rate in sector 2 falls. • Because $6 is less than the competitive wage of $9, workers are not allocated to their most productive jobs. • The wage floor yields an equilibrium with underemployment.
Figure 12.6 Wage floors and search unemployment in a two-sector model
Figure 12.6: The Unemployment Equilibrium • The equilibrium wage in sector 2 of the underemployment model is lower than the sector 2 wage of the unemployment model. • In unemployment model, some non-unionized workers will leave sector 2 to chase union jobs in sector 1. • As a result, the smaller number on non-unionized workers remaining in sector 2 will earn a higher wage.
Figure 12.6: The Unemployment Equilibrium • Two sources of inefficiency arise in this model: • There is unemployment equal to u in quadrant I of Figure 12.6. • The allocation of workers who are employed is inefficient because the wage floor exceeds the equilibrium wage.
The Efficient Transfer Mechanism • Although the lump-sum mechanism is efficient, it is not practical. • There is no systematic way of choosing a target indifference curve or identifying individual preferences and budgets to pinpoint recipients. • As a result, maintenance policies are formulated in terms of income rather than utility (income-maintenance).
Income-Maintenance Programs • Income-maintenance programs have the objective of raising the income of anyone below a targeted level of income, up to that level. • In practical income-maintenance schemes, the amount of the income transfer is conditional upon the amount of the recipient’s earned income.