Download
1 / 18
180 likes | 300 Vues
This lesson delves into calculating the mean running yardage for a series of football plays and mastering the graphing of points on a coordinate plane. Students will analyze the running statistics of a football game—specifically, the given yardage per play—and learn how to determine the average. Additionally, they will practice plotting ordered pairs, identifying the quadrants, and exploring algebraic relationships through graphs. By engaging with various examples and exercises, learners will bolster their understanding of both statistical analysis and coordinate geometry.

E N D
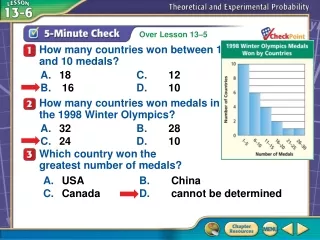
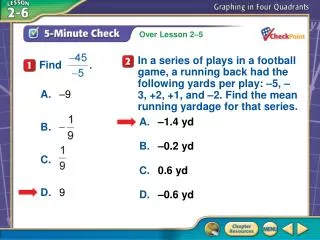
A B C D Find . A.–9 B. C. D.9 In a series of plays in a football game, a running back had the following yards per play: –5, –3, +2, +1, and –2. Find the mean running yardage for that series. A. –1.4 yd B. –0.2 yd C. 0.6 yd D. –0.6 yd 5-Minute Check 1
You have already used ordered pairs to name and locate points. (Lesson 1–4) • Graph points on a coordinate plane. • Graph algebraic relationships. Then/Now
quadrants Vocabulary
Recall…we discussed the 4 Quadrants earlier in the year. Today, we will work with all 4 Quadrants. Y-axis Quadrant II (-,+) Quadrant I (+,+) X-axis Quadrant III (-,-) Quadrant IV (+,-) Origin (0,0) I give you the Coordinate Plane (we need graph paper now)
Write Ordered Pairs A. Write the ordered pair that names point P. The x-coordinate is 4. The y-coordinate is –2. Answer: The ordered pair is (4, –2). Example 1
Write Ordered Pairs B. Write the ordered pair that names point Q. The x-coordinate is –3. The y-coordinate is –1. Answer: The ordered pair is (–3, –1). Example 1
A B C D A. Write the ordered pair that names point M. A. (2, 3) B. (–3, –2) C. (–2, –3) D. (–3, 2) Example 1
A B C D B. Write the ordered pair that names point N. A. (4, –1) B. (4, 1) C. (1, –4) D. (–1, 4) Example 1
Graph Points and Name the Quadrant A. Graph and label S(–1, –5) on a coordinate plane. Name the quadrant in which the point lies. Start at the origin. Move 1 unit left. Then move 5 units down and draw a dot. Answer: Point S is in Quadrant III. Example 2
Graph Points and Name the Quadrant B. Graph and label U(–2, 3) on a coordinate plane. Name the quadrant in which the point lies. Start at the origin. Move 2 units left. Then move 3 units up and draw a dot. Answer: Point U is in Quadrant II. Example 2
A B C D A. Graph and label A(3, –4) on a coordinate plane. Name the quadrant in which the point lies. A. Quadrant I B. Quadrant II C. Quadrant III D. Quadrant IV Example 2
A B C D B. Graph and label B(–2, 1) on a coordinate plane. Name the quadrant in which the point lies. A. Quadrant I B. Quadrant II C. Quadrant III D. Quadrant IV Example 2
Graph an Algebraic Relationship GAMES Mrs. Gossell’s class is playing a classroom quiz game. The difference between Ali’s and Joachim’s scores is 3 points. If x represents Ali’s score and y represents Joachim’s score, make a table of possible values for x and y. Then graph the ordered pairs and describe the graph. First, make a table. Choose values for x and y that have a difference of 3. Example 3
Graph an Algebraic Relationship Then graph the ordered pairs on a coordinate plane. Example 3
Graph an Algebraic Relationship Answer:The points in the graph are on a line that slants upward to the right. The line crosses the y-axis at y = –3. Example 3
A B C D A.B. C.D. A. The sum of two integers is 3. If x represents the first integer and y represents the second integer, make a table of possible values for x and y. Example 3