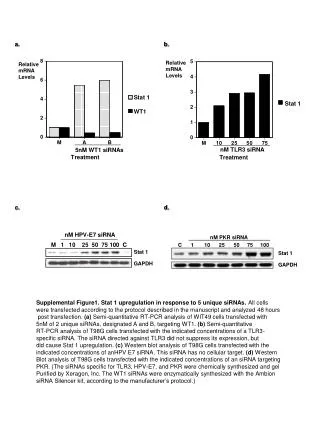
Therapeutic Modulation of HEXIM-1 mRNA by JQ1 and Volasertib in Leukemia Cells
110 likes | 129 Vues
This study investigates the impact of JQ1 and volasertib on HEXIM-1 mRNA levels in MV-4-11B leukemia cells using qRT-PCR and FACS analysis to assess cell cycle and apoptosis. The combination of BI 894999 and volasertib significantly induced Caspase 3/7 activation, indicating potential therapeutic efficacy. Immunofluorescence staining revealed increased apoptosis in treated cells. Moreover, FACS analysis of peripheral blood and bone marrow in mice treated with BI 894999 and volasertib shows promising results in leukemia xenograft models. Bodyweight changes in xenografts suggest a potential therapeutic benefit of the drug combination. Cell lines were authenticated using STR analysis.

Therapeutic Modulation of HEXIM-1 mRNA by JQ1 and Volasertib in Leukemia Cells
E N D
Presentation Transcript
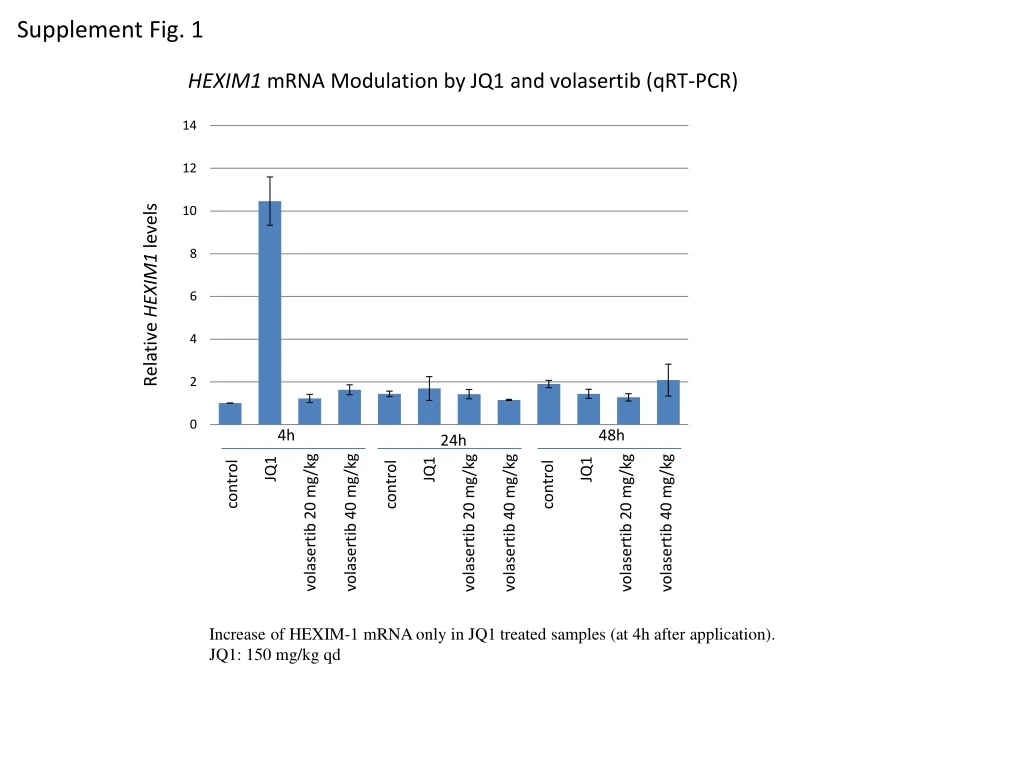
Supplement Fig. 1 HEXIM1 mRNA Modulation by JQ1 andvolasertib (qRT-PCR) Relative HEXIM1 levels 4h 48h 24h JQ1 JQ1 JQ1 control control control volasertib 20 mg/kg volasertib 40 mg/kg volasertib 20 mg/kg volasertib 40 mg/kg volasertib 20 mg/kg volasertib 40 mg/kg Increase of HEXIM-1 mRNA only in JQ1 treated samples (at 4h after application). JQ1: 150 mg/kg qd
Supplement Fig. 2.1 MV-4-11B: 24h treatmentwith volasertib and/or BI 894999 FACS cellcycleanalysis Fig. 1: Cell Cycle Analysis of logarithmically growing MV-4-11B cells, incubated with 1x and 3x EC50 concentrations of volasertib and 0.3x, 1x and 3x EC50concentrations of BET inhibitor BI 894999 orcombination of both. Treatment for 24, 48 and72h followedby PI stainingandanalysis in FACScalibur. Percentagesof cells in therespectivecellcyclephasesareplotted.
Supplement Fig. 2.2 MV-4-11B: 48h treatmentwith volasertib and/or BI 894999 FACS cellcycleanalysis
Supplement Fig. 2.3 MV-4-11B: 72h treatmentwith volasertib and/or BI 894999 FACS cellcycleanalysis
Supplement Fig. 3 Determination of Apoptosis by Caspase 3/7 staining Incucyteanalysis. MV-4-11B cellswere treated andanalyzedover time withtheIncuCyte™Caspase-3/7 Apoptosis Assay Reagent (Essenbioscience Cat No 4440) BI 894999 + volasertib: Increase in Caspase 3/7 staining in thecombinationsetting( ) Method: Incucyteassay MV-4-11B cells were plated (1×10⁴/well) in 96-well plates (BD BioCoat poly-d-lysine–coated black/clear bottom plate). The next day, compounds were added at the concentrations indicated. For apoptosis detection, Cell Player Kinetic caspase-3/7 Reagent (Essen BioScience, Ann Arbor, MI), diluted in medium to a final concentration of 1.25 µM was added at the same time. Cell confluence and green fluorescence as a measure of caspase-3/7 activation were monitored for 36 hours with images taken every 3 hours.
Supplement Fig. 4 Method: Immunofluorescence staining Cytospins were fixed, permeabilized and stained as described earlier (Rudolph 2009). As first antibody anti-tubulin (Sigma T6199) was diluted 1:1000 and anti-phospho-histone H3 antibody (Cell Signaling #9701) 1:200, in PBS 2% bovine serum albumin, followed by fluorescence labeled secondary antibodies. Cells were mounted in ProLong gold with DAPI (life technologies, #P36931) and analyzed using a Zeiss Laser scanning microscope (LSM700). A B C D MV-4-11B cells treated withtheindicatedcompounds and concentrationsfor24h. A: DMSO control, B: 60 nM volasertib, C: 10 nM BI 894999, D: combination of both. Cytospinsandimmunofluorescence staining for tubulin (green), DNA (DAPI, blue) and pH3 (red). High number of apoptoticcellsalready after 24hrs
Supplement Fig. 5.1: FACS analysis of peripheralblood of control mice at day 8 andday 39 Mouse 1 Mouse 2 Mouse 3 Day 8 Day 8 Day 39 Mouse 1 Mouse 2 E+04:2,39 3,38 2,80 E+07: 9,60 4,30 1 2 3 Day 39 1 2 Method: Peripheral blood was collected and red blood cell lysis was performed with BD Phram Lyse (BD Bioscience). Cells were stained with anit-human-CD45-PE antibody (Clone: 2D1; AffymetrixeBioscience) as described in the eBioscience data sheet. Flow cytometer were acquired on a FACSCalibur (BD Bioscience) and data analysis was performed with FlowJosofware (Tree Star). CD45 FCS
Supplement Fig. 5.2: FACS analysis of bone marrow of mice treated with 4 mg/kg BI 894999 and 20 mg/kg volasertib at day 149 Mouse 49 Mouse 50 Mouse 51 Mouse 52 Mouse 54 Mouse 55 Mouse 56 CD45 Method: Bone marrow was collected form the femur and red blood cell lysis was performed with BD Phram Lyse (BD Bioscience). Cells were stained with anit-human-CD45-PE antibody (Clone: 2D1; AffymetrixeBioscience) as described by the eBioscience data sheet. Flow cytometer were acquired on a FACSCalibur (BD Bioscience) and data analysis was performed with FlowJosofware (Tree Star). All animals were animals were sacrificedt at day 149 FCS
Supplement Fig. 6 MV-4-11B xenograft: Median bodyweightchange MV-4-11B xenograft: Single animals Radiance [p/sec/cm2/sr] Log scale vehicle Vehicle control 4 mg/kg BI 894999 2 mg/kg BI 894999 20 mg/kg volasertib 2 mg/kg BI 894999 4 mg/kg BI 894999 2 mg/kg BI 894999 + 20 mg/kg volasertib 4 mg/kg BI 894999 + 20 mg/kg volasertib 20 mg/kg volasertib 2 mg/kg BI 894999 + 20 mg/kg volasertib 4 mg/kg BI 894999 + 20 mg/kg volasertib
Supplement Fig. 7 THP-1 xenograft: Median bodyweightchange THP-1 xenograft: Single animals Log scale Vehicle control 4 mg/kg BI 894999 20 mg/kg volasertib 0.5mg/kg Decitabine 4 mg/kg BI 894999 + 20 mg/kg volasertib 4 mg/kg BI 894999 + 0.5 mg/kg decitabine Volasertib 20 mg/kg BI 894999 4 mg/kg + Volasertib 20 mg/kg
Supplement Fig. 8 Cell lines were cultured according to the manufacturer's instruction and authenticated by short tandem repeat (STR) analysis at BoehringerIngelheim on the dates indicated