Relative mRNA Levels
Relative mRNA Levels. Stat 1. nM HPV-E7 siRNA. nM PKR siRNA. nM TLR3 siRNA. M 1 10 25 50 75 100 C . C 1 10 25 50 75 100. Treatment. Stat 1 GAPDH. Stat 1 GAPDH. a. b. Relative mRNA Levels. Stat 1 WT1.

Relative mRNA Levels
E N D
Presentation Transcript
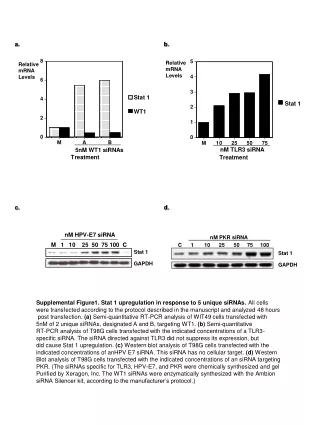
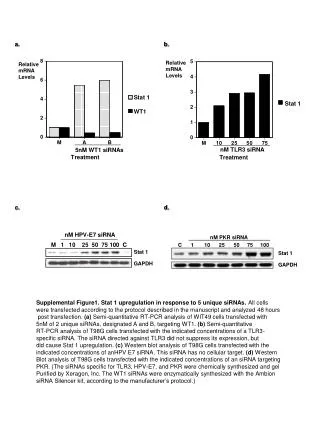
Relative mRNA Levels Stat 1 nM HPV-E7 siRNA nM PKR siRNA nM TLR3 siRNA M 1 10 25 50 75 100 C C 1 10 25 50 75 100 Treatment Stat 1 GAPDH Stat 1 GAPDH a. b. Relative mRNA Levels Stat 1 WT1 5nM WT1 siRNAs Treatment c. d. Supplemental Figure1. Stat 1 upregulation in response to 5 unique siRNAs. All cells were transfected according to the protocol described in the manuscript and analyzed 48 hours post transfection. (a) Semi-quantitative RT-PCR analysis of WIT49 cells transfected with 5nM of 2 unique siRNAs, designated A and B, targeting WT1. (b) Semi-quantitative RT-PCR analysis of T98G cells transfected with the indicated concentrations of a TLR3- specific siRNA. The siRNA directed against TLR3 did not suppress its expression, but did cause Stat 1 upregulation. (c) Western blot analysis of T98G cells transfected with the indicated concentrations of anHPV E7 siRNA. This siRNA has no cellular target. (d) Western Blot analysis of T98G cells transfected with the indicated concentrations of an siRNA targeting PKR. (The siRNAs specific for TLR3, HPV-E7, and PKR were chemically synthesized and gel Purified by Xeragon, Inc. The WT1 siRNAs were enzymatically synthesized with the Ambion siRNA Silencer kit, according to the manufacturer’s protocol.)
a b Relative mRNA Levels ISG 15 ISG 56-K IFIT 1 Relative mRNA Levels nM GAPDH siRNA RCC1 Cell Treatment ISG 15 ISG 56-K IFIT 1 ss C M 10 25 50 100 ss C M 10 ss C M 10 ss C M 10 OAS2 ISG 15 RCC1 T98G RCC1 T98G nM GAPDH siRNA T98G Cell Treatment Supplemental Figure 2. Verification of ISG Microarray Analysis. (a) Northern blot analysis showing upregulation of two representative ISGs, OAS 2 and ISG 15, in response to GAPDH siRNA in the two cell lines, RCC1 and T98G. (The numbers indicate the concentration of siRNA; ss, 10nM single GAPDH sense strand 21-mer) (b) Expression of three representative ISGs (ISG 15, ISG 56-K, and IFIT 1) from the ISG microarray experiment were analyzed by semi-quantitative RT-PCR to confirm their upregulation in response to siRNA transfection. The top panel shows the response seen in RCC1 cells. The bottom panel shows the response seen in T98G cells.
nM GAPDH siRNA M ss25 25 P-PKR (Thr 446/451) Total PKR Supplemental Figure 3. In vivo phosphorylation of PKR on threonine residues 446/451 in response to GAPDH siRNA. T98G cells were transfected with the indicated concentrations of either the single stranded 21-mer or the double stranded GAPDH siRNA at the indicated concentration. Whole cell lysates were collected 90 minutes post transfection and a PKR immunoprecipitation was performed accounding to the protocol described in the manuscript. The siRNA caused PKR autophosphorylation on thr 446 and 451 to levels above both single stranded and mock transfected.
a b Normalized GL3 Luciferase 21bp GL3 siRNA 21bp RL siRNA WT MEF IRF9 Stat1 Type I IFN Null Null Null Cell Lines Normalized GL3 Luciferase 500bp IR RNA 500bp IR RNA WT MEF IRF9 Stat1 Type I IFN Null Null Null Cell Lines Supplemental Figure 4.RNA interference of GL3 luciferase by 21bp siRNA in mutant cell lines. Fold change of GL3 luciferase for each cell line was normalized to its own reporter control (pGL3-Control + pRL-SV40), which was given a value of 1. The graphs represent data averaged from at least 3 independent experiments +/- standard deviation. (a) 21 bp siRNA directed against GL3 luciferase mediated sequence specific silencing while (b) 500 bp IR RNAmediated non-specific silencing of GL3 luciferase in both wild type cells and in cells lacking either IRF 9, Stat 1, or Type I IFN.