
Describing Location, Transforming Data, and Percentiles in Distributions - Chapter 2
This chapter focuses on describing location in a distribution, understanding percentiles, estimating values using graphs, interpreting standardized scores, and the effects of adding, subtracting, multiplying, or dividing constants on distribution shape, center, and spread.

Describing Location, Transforming Data, and Percentiles in Distributions - Chapter 2
E N D
Presentation Transcript
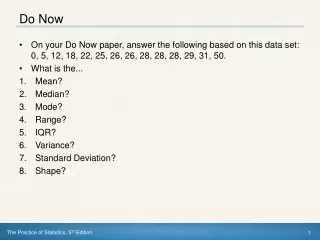
Do Now • On your Do Now paper, answer the following based on this data set: 0, 5, 12, 18, 22, 25, 26, 26, 28, 28, 28, 29, 31, 50. • What is the... • Mean? • Median? • Mode? • Range? • IQR? • Variance? • Standard Deviation? • Shape?
CHAPTER 2Modeling Distributions of Data 2.1Describing Location in a Distribution
Describing Location in a Distribution • FIND and INTERPRET the percentile of an individual value within a distribution of data. • ESTIMATE percentiles and individual values using a cumulative relative frequency graph. • FIND and INTERPRET the standardized score (z-score) of an individual value within a distribution of data. • DESCRIBE the effect of adding, subtracting, multiplying by, or dividing by a constant on the shape, center, and spread of a distribution of data.
Transforming Data Transforming converts the original observations from the original units of measurements to another scale. Transformations can affect the shape, center, and spread of a distribution. Effect of Adding (or Subtracting) a Constant • Adding the same number a to (subtracting a from) each observation: • adds a to (subtracts a from) measures of center and location (mean, median, quartiles, percentiles), but • Does not change the shape of the distribution or measures of spread (range, IQR, standard deviation).
Transforming Data Example Examine the distribution of students’ guessing errors by defining a new variable as follows: error = guess − 13 That is, we’ll subtract 13 from each observation in the data set. Try to predict what the shape, center, and spread of this new distribution will be.
Transforming Data Transforming converts the original observations from the original units of measurements to another scale. Transformations can affect the shape, center, and spread of a distribution. Effect of Multiplying (or Dividing) by a Constant • Multiplying (or dividing) each observation by the same number b: • multiplies (divides) measures of center and location (mean, median, quartiles, percentiles) by b • multiplies (divides) measures of spread (range, IQR, standard deviation) by |b|, but • does not change the shape of the distribution
Transforming Data Example Because our group of Australian students is having some difficulty with the metric system, it may not be helpful to tell them that their guesses tended to be about 2 to 3 meters too high. Let’s convert the error data to feet before we report back to them. There are roughly 3.28 feet in a meter.
Describing Location in a Distribution • FIND and INTERPRET the percentile of an individual value within a distribution of data. • ESTIMATE percentiles and individual values using a cumulative relative frequency graph. • FIND and INTERPRET the standardized score (z-score) of an individual value within a distribution of data. • DESCRIBE the effect of adding, subtracting, multiplying by, or dividing by a constant on the shape, center, and spread of a distribution of data.
Homework • Finish HW 2.1 and turn in tomorrow


