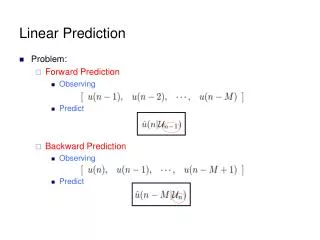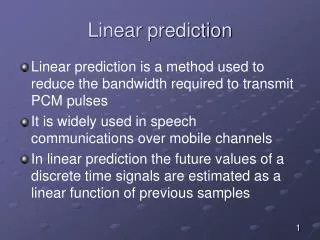
Linear Prediction
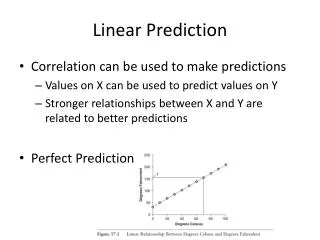
Linear Prediction. Correlation can be used to make predictions Values on X can be used to predict values on Y Stronger relationships between X and Y are related to better predictions Perfect Prediction. Inaccurate Predictions.

Linear Prediction
E N D
Presentation Transcript
Linear Prediction • Correlation can be used to make predictions • Values on X can be used to predict values on Y • Stronger relationships between X and Y are related to better predictions • Perfect Prediction
Inaccurate Predictions • Predictions will be inaccurate for correlations coefficients less than 1 or greater than -1
Prediction Line • A prediction line, or regression line, is used to estimate values on Y when the relationship between X and Y is less than 1 or greater than -1
Best Fit Line • The goal of the best fit line is to reduce the error between Y (actual Y scores) and Y’ (estimated Y scores based on X)
Formula for Best Fit Line • The steps for obtaining the best fit line are 1. First, we find the deviation of the actual score from the predicted score. That is, we find Y - Y′ (prediction error). 2. Then, we square the prediction error. 3. We do this for every X score along the line. 4. Then, we sum those squared prediction errors. 5. Finally, we repeat this process for every possible line. 6. We then choose the line for which the sum of the squared prediction errors (Step 4) is the smallest
Equation for Best Fit Line • Equation for any straight line • Y = bX + a • Formula for a Best Fit Line