Download

1 / 72
720 likes | 737 Vues
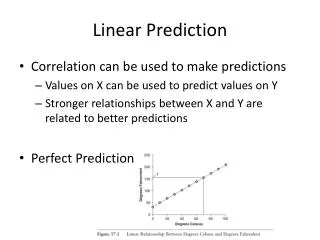
Statistically rigorous evaluation of linear models for predicting host load behavior with a focus on task execution times and scheduling. Results show the utility of using simple linear models for accurate load predictions.

E N D
An Evaluation of Linear ModelsforHost Load Prediction Peter A. Dinda David R. O’Hallaron Carnegie Mellon University
Motivating Questions • What are the properties of host load? • Is host load predictable? • What predictive models are appropriate? • Are host load predictions useful?
Overview of Answers • Host load exhibits complex behavior • Self-similarity, epochal behavior • Host load is predictable • 1 to 30 second timeframe • Simple linear models are sufficient • Recommend AR(16) or better • Predictions lead to useful estimates of task execution timesStatistically rigorous approach
Outline • Context: predicting task execution times • Mean squared load prediction error • Offline trace-based evaluation • Host load traces • Linear models • Randomized methodology • Results of data-mining • Online prediction of task execution times • Related work • Conclusion
Prediction-based Best-effort Distributed Real-time Scheduling Task notifies scheduler of its CPU requirements (nominal time) and its deadline Scheduler acquires predicted task execution times for all hosts Scheduler assigns task to a host where its deadline can be met Predicted Exec Time deadline ? Task nominal time deadline
Predicted Exec Time deadline Predicting Task Execution Times Exec Time Model 1 to 30 second predictions Load Predictor DEC Unix 5 second load average sampled at 1 Hz Load Sensor ? Task nominal time deadline
Confidence Intervals Bad Predictor No obvious choice Good Predictor Two good choices Predicted Exec Time Predicted Exec Time deadline Good predictors provide smaller confidence intervals Smaller confidence intervals simplify scheduling decisions
Predicted Exec Time deadline Load Prediction Focus Exec Time Model CI length determined by mean squared error of predictor Load Predictor Load Sensor ? Task nominal time deadline
Load Predictor Operation Measurements in Fit Interval Model Type <zt-m,...,zt-2 ,zt-1> Modeler z’t+2,t+2+w z’t+1,t+1+w z’t,t+w ... Model ... ... ... z’t+2,t+4 z’t+1,t+3 Measurements in Test Interval z’t,t+2 ... z’t+2,t+3 z’t+1,t+2 Load Predictor z’t,t+1 ... zt+n-1,…,zt+1 ,zt Prediction Stream Error Estimates Evaluator One-time use Production Stream Error Metrics
(z’t+i,t+i+w - zt+i+w)2 (z’t+i,t+i+1 - zt+i+1 )2 (z’t+i,t+i+2 - zt+i+2 )2 Mean Squared Error z’t+2,t+2+w z’t+1,t+1+w z’t,t+w ... w step ahead predictions ... ... ... ... Load Predictor z’t+2,t+4 z’t+1,t+3 z’t,t+2 …,zt+1 ,zt ... 2 step ahead predictions z’t+2,t+3 z’t+1,t+2 z’t,t+1 ... 1 step ahead predictions s2z = (m - zt+i)2 Variance of z s2aw= w step ahead mean squared error ... ... s2a2= 2 step ahead mean squared error s2a1= 1 step ahead mean squared error Good Load Predictor : s2a1,s2a2 ,…,s2aw << s2z
CIs From Mean Squared Error 95 % CI for exec time available in next second Predicted Load = 1.0
Example of Improving the Confidence Interval Massive reduction in confidence interval length using prediction Do such benefits consistently occur?
Outline • Context: predicting task execution times • Mean squared load prediction error • Offline trace-based evaluation • Host load traces • Linear models • Randomized methodology • Results of data-mining • Online prediction of task execution times • Related work • Conclusion
Host Load Traces • DEC Unix 5 second exponential average • Full bandwidth captured (1 Hz sample rate) • Long durations • Also looked at “deconvolved” traces
Salient Properties of Load Traces +/- Extreme variation + Significant autocorrelation Suggests appropriateness of linear models + Significant average mutual information - Self-similarity / long range dependence +/- Epochal behavior + Stable spectrum during an epoch - Abrupt transitions between epochs + encouraging for prediction- discouraging for prediction (Detailed study in LCR98, SciProg99)
Linear Models (2000 sample fits, largest models in study, 30 steps ahead)
AR(p) Models • Fast to fit (4.2 ms, AR(32), 2000 points) • Fast to use (<0.15 ms, AR(32), 30 steps ahead) • Potentially less parsimonious than other models next value weights chosen to minimize mean square error for fit interval p previous values error
Evaluation Methodology • Ran ~152,000 randomly chosen testcases on the traces • Evaluate models independently of prediction/evaluation framework • ~30 testcases per trace, model class, parameter set • Data-mine results Offline and online systems implemented using RPS Toolkit
Testcases • Models • MEAN, LAST/BM(32) • Randomly chosen model from: AR(1..32), MA(1..8), ARMA(1..8,1..8), ARIMA(1..8,1..2,1..8), ARFIMA(1..8,d,1..8)
Evaluating a Testcase Measurements in Fit Interval Model Type <zt-m,...,zt-2 ,zt-1> Modeler z’t+2,t+2+w z’t+1,t+1+w z’t,t+w ... Model ... ... ... z’t+2,t+4 z’t+1,t+3 Measurements in Test Interval z’t,t+2 ... z’t+2,t+3 z’t+1,t+2 Load Predictor z’t,t+1 ... zt+n-1,…,zt+1 ,zt Prediction Stream Error Estimates Evaluator One-time use Production Stream Error Metrics
Error Metrics • Summary statistics for the 1,2,…,30 step ahead prediction errors of all three models • Mean squared error • Min, median, max, mean, mean absolute errors • IID tests for 1 step ahead errors • Significant residual autocorrelations, Portmanteau Q (power of residuals), turning point test, sign test • Normality test (R2 of QQ plot) for 1 step ahead errors
Database • 54 values characterize testcase, lead time • SQL queries to answer questions “How much do AR(16) models reduce the variability of 1 second ahead predictions?” select count(*), 100*avg((testvar-msqerr)/testvar) as avgpercentimprove from big where p=16 and q=0 and d=0 and lead=1 +----------+-------------------+ | count(*) | avgpercentimprove | +----------+-------------------+ | 1164 | 66.7681346166 | +----------+-------------------+
Comparisons • Paired • MEAN vs BM/LAST vs another model • Unpaired • All models • Unpaired t-test to compare expected mean square errors • Box plots to determine consistency
Inconsistent low error Consistent high error 97.5% Mean Squared Error 75% Consistent low error Mean 50% 25% Model A Model B Model C 2.5% Unpaired Box Plot Comparisons Good models achieve consistently low error
1 second Predictions, All Hosts 97.5% 75% Mean 50% 25% 2.5% Predictive models clearly worthwhile
15 second Predictions, All Hosts 97.5% 75% Mean 50% 25% 2.5% Predictive models clearly worthwhile Begin to see differentiation between models
30 second Predictions, All Hosts 97.5% 75% Mean 50% 25% 2.5% Predictive models clearly beneficial even at long prediction horizons
1 Second Predictions, Dynamic Host 97.5% 75% Mean 50% 25% 2.5% Predictive models clearly worthwhile
15 Second Predictions, Dynamic Host 97.5% 75% Mean 50% 25% 2.5% Predictive models clearly worthwhile Begin to see differentiation between models
30 Second Predictions, Dynamic Host 97.5% 75% Mean 50% 25% 2.5% Predictive models clearly worthwhile Begin to see differentiation between models
Outline • Context: predicting task execution times • Mean squared load prediction error • Offline trace-based evaluation • Host load traces • Linear models • Randomized methodology • Results of data-mining • Online prediction of task execution times • Related work • Conclusion
Online Prediction of Task Execution Times • Replay selected load trace on host • Continuously run 1 Hz AR(16)-based host load predictor • Select random tasks • 5 to 15 second intervals • 0.1 to 10 second nominal times • Estimate exec time using predictions • Assume priority-less round-robin scheduler • Execute task • record nominal, predicted, and actual exec times
On-line Prediction Results Nominal time as prediction Load prediction based All tasks usefully predicted 10% of tasks drastically mispredicted Measurement of 1000 0.1-30 second tasks on lightly loaded host Prediction is beneficial even on lightly loaded hosts
On-line Prediction Results Nominal time as prediction Load prediction based 74% of tasks mispredicted 3% of tasks mispredicted Measurement of 3000 0.1-30 second tasks on heavily loaded, dynamic host Prediction is beneficial on heavily loaded, dynamic hosts
Related Work • Workload studies for load balancing • Mutka, et al [PerfEval ‘91] • Harchol-Balter, et al [SIGMETRICS ‘96] • Host load measurement and studies • Network Weather Service [HPDC‘97, HPDC’99] • Remos [HPDC’98] • Dinda [LCR98, SciProg99] • Host load prediction • Wolski, et al [HPDC’99] (NWS) • Samadani, et al [PODC’95]
Conclusions • Rigorous study of host load prediction • Host load is predictable despite its complex behavior • Simple linear models are sufficient • Recommend AR(16) or better • Predictions lead to useful estimates of task running time
Availability • RPS Toolkit • http://www.cs.cmu.edu/~pdinda/RPS.html • Includes on-line and off-line prediction tools • Load traces and tools • http://www.cs.cmu.edu/~pdinda/LoadTraces/ • Prediction testcase database • Available by request (pdinda@cs.cmu.edu) • Remos • http://www.cs.cmu.edu/~cmcl/remulac/remos.html
Linear Time Series Models Unpredictable Random Sequence Partially Predictable Load Sequence Fixed Linear Filter Choose weightsyj to minimize sa2 sa is the confidence interval for t+1 predictions
Req/Resp Stream Online Resource Prediction System Application Application Application Buffer Prediction Stream Refit Signal Predictor Evaluator User Control Measurement Stream Sensor
Load Predictor Prediction Errors z’t+2,t+2+w z’t+1,t+1+w z’t,t+w ... w step ahead predictions ... ... ... ... z’t+2,t+4 z’t+1,t+3 z’t,t+2 …,zt+1 ,zt ... 2 step ahead predictions z’t+2,t+3 z’t+1,t+2 z’t,t+1 ... 1 step ahead predictions i=0,1,... <z’t+i,t+i+1 - zt+i+1 > 1 step ahead prediction errors
Load Predictor Prediction Errors z’t+2,t+2+w z’t+1,t+1+w z’t,t+w ... w step ahead predictions ... ... ... ... z’t+2,t+4 z’t+1,t+3 z’t,t+2 …,zt+1 ,zt ... 2 step ahead predictions z’t+2,t+3 z’t+1,t+2 z’t,t+1 ... 1 step ahead predictions i=0,1,... <z’t+i,t+i+2 - zt+i+2 > 2 step ahead prediction errors <z’t+i,t+i+1 - zt+i+1 > 1 step ahead prediction errors
Load Predictor Prediction Errors z’t+2,t+2+w z’t+1,t+1+w z’t,t+w ... w step ahead predictions ... ... ... ... z’t+2,t+4 z’t+1,t+3 z’t,t+2 …,zt+1 ,zt ... 2 step ahead predictions z’t+2,t+3 z’t+1,t+2 z’t,t+1 ... 1 step ahead predictions i=0,1,... <z’t+i,t+i+w - zt+i+w> w step ahead prediction errors ... ... <z’t+i,t+i+2 - zt+i+2 > 2 step ahead prediction errors <z’t+i,t+i+1 - zt+i+1 > 1 step ahead prediction errors
Load Predictor (z’t+i,t+i+w - zt+i+w)2 (z’t+i,t+i+1 - zt+i+1 )2 (z’t+i,t+i+2 - zt+i+2 )2 Mean Squared Error z’t+2,t+2+w z’t+1,t+1+w z’t,t+w ... w step ahead predictions ... ... ... ... z’t+2,t+4 z’t+1,t+3 z’t,t+2 …,zt+1 ,zt ... 2 step ahead predictions z’t+2,t+3 z’t+1,t+2 z’t,t+1 ... 1 step ahead predictions i=0,1,... s2aw= w step ahead mean squared error ... ... s2a2= 2 step ahead mean squared error s2a1= 1 step ahead mean squared error
Load Predictor Operation z’t+2,t+2+w z’t+1,t+1+w z’t,t+w ... w step ahead predictions ... ... ... ... Load Predictor z’t+2,t+4 z’t+1,t+3 z’t,t+2 …,zt+1 ,zt ... 2 step ahead predictions z’t+2,t+3 z’t+1,t+2 z’t,t+1 ... 1 step ahead predictions
CIs From Mean Squared Error s2a1= 0.1 “one second ahead predictions are this bad” z’t,t+1 = 1.0 “load in next second is predicted to be 1.0” z’t,t+1 = [1.0 - 1.96sa1, 1.0 + 1.96sa1] with 95% confidence z’t,t+1 = [0.38, 1.62] with 95% confidence texec = 1/(1+z’t,t+1) “your task will execute this long in the next second” texec = 1/(1+1.0) = 0.5 seconds texec = 1/(1+[0.38, 1.62]) = [0.38, 0.72] seconds with 95% confidence s2a1= 0.01 texec = 1/(1+[0.8, 1.2]) = [0.45, 0.56] seconds with 95% confidence