Unveiling Mercury's Impact: Northeastern US Study
300 likes | 395 Vues
Discover key findings from scientific studies on biological mercury hotspots in the Northeastern US and Southeastern Canada. Explore causes, implications for freshwater ecosystems, and policy implications. Learn from leading researchers about airborne mercury emissions, coal-fired power plants, and the urgent need for environmental action to mitigate mercury contamination.

Unveiling Mercury's Impact: Northeastern US Study
E N D
Presentation Transcript
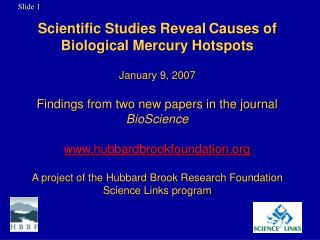
Slide 1 Scientific Studies RevealCauses ofBiological Mercury Hotspots January 9, 2007Findings from two new papers in the journal BioSciencewww.hubbardbrookfoundation.orgA project of the Hubbard Brook Research FoundationScience Links program
Slide 2 11 Authors Charles T. Driscoll, PhD – Syracuse University David Evers, PhD - BioDiversity Research Institute Thomas Butler, PhD – Cornell University Celia Y. Chen, PhD – Dartmouth College Thomas A. Clair, PhD – Environment Canada M. Wing Goodale – BioDiversity Research Institute Young-Ji Han, PhD – HBRF Thomas M. Holsen, PhD – Clarkson University Neil C. Kamman – Vermont DEC Kathy Lambert – Hubbard Brook Research Foundation Ron Munson, PhD – Tetra Tech Present today for comment – Gerald Keeler, PhD – University of Michigan
Slide 3 New BioScience Studies Mercury Contamination in Forest and Freshwater Ecosystems in the Northeastern United States: Sources, Transformations, and Management Options Biological Mercury Hotspots in the Northeastern U.S. and Southeastern Canada Mercury Matters: Linking Mercury Science with Public Policy in the Northeastern United States
Slide 4 Outline of Today’s Presentation 1. Background – Kathy Fallon Lambert 2. What are Biological Mercury Hotspots? – David Evers 3. What are the Causes? – Charles Driscoll 4. How Significant are U.S. Coal-fired Power Plants? – Thomas Holsen 5. Conclusions – Charles Driscoll
Slide 5 Key Findings 1. Biological mercury hotspots do exist. 2. Specific hotspots linked to causes for the first time. 3. Airborne mercury emissions are the dominant source. 4. They produce a double-whammy in watersheds hit by decades of acid rain. 5. And cause ripple effects in reservoirs that are manipulated for power production. 6. New Hampshire case study demonstrates we’ve reached tipping point: coal-fired power plants have significant local impacts that are under-estimated by EPA. 7. Good news – document for first time in the Northeast that rapid recovery in fish and loons can occur if local emissions reduced. 8. Findings validate state concerns about mercury trading and need for new draft Federal legislation.
Slide 6 What is Mercury and Why is it a Problem? 44 states have one or more fish advisories
Slide 7 Where Does Mercury in Fish and Wildlife Come From?
Slide 8 Where Does Mercury Pollution Come From? Total: 2076 short tons Total: 2496 short tons
Slide 9 Northeast Sediment Trends Reflect US Emissions Pattern Pirrone et al. 1998, Lorey and Driscoll 1999.
US EPA Clean Air Mercury Rule Two-phase program for coal-fired power plants 20% reduction by 2010 70% reduction by 2025 Cap-and-trade approach State Implementation Plans Approx. 24 of 30 states filed more stringent plans 21 = deeper cuts 18 = faster cuts 17 = no trading Slide 10 What is the Current Mercury Policy Context?
Slide 11 What Are Biological Mercury Hotspots and Where Do They Occur? David C. Evers, PhD BioDiversity Research Institute
Slide 12 Biological Mercury Hotspot Definition “A location on the landscape that, compared to the surrounding landscape, is characterized by elevated concentrations of mercury in fish and wildlife that exceed established human or wildlife health criteria as determined by a statistically adequate sample size.” Evers et al. 2007.
Slide 13 Biological Mercury Hotspots Upper Ken. and Andro. Rivers Nova Scotia Upper Connecticut River Lower Merrimack watershed 5 confirmed 9 suspected Adirondacks Evers et al. 2007.
Slide 14 Methods 1. Based on 7,311 observations 2. Human health analysis - Indicator = yellow perch - Threshold = 0.3 ppm (EPA criterion) 3. Ecological health analysis - Indicator = Common loon blood - Threshold = 3.0 ppm
1. We used a more inclusive definition of hotspot. - Not limited to “consumable fish” with methyl mercury concentrations “attributable solely to utilities” above EPA criterion of 0.3 ppm 2. By focusing regionally and on more species, we used a larger biological database. - Not limited to select sites and species from the National Fish Tissue Survey and Advisory Listing. Slide 15 How Does Our Approach Differ From EPA’s?
Slide 16 What are the Causes of Biological Mercury Hotspots? Charles T. Driscoll, PhD Syracuse University
Slide 17 New Results: Causes of Biological Mercury Hotspots Global and Regional Atmospheric Emissions and Deposition Reservoir Fluctuations Local Emissions Landscape Sensitivity Evers et al. 2007.
Slide 18 We Found that Some Biological Hotspots Are Caused by Moderate Mercury Deposition to Sensitive Watersheds • Sensitive Watersheds: • Abundant forest cover and wetlands • Impacted by acid rain • Shallow groundwater flow paths Areas like the Adirondacks receive double-whammy of acid rain and mercury. Driscoll et al. 2007.
Slide 19 New Finding: Biological Hotspots Detected in Reservoirs Manipulated for Power Production Evers et al. 2007.
Slide 20 Mercury Levels Higher in Reservoirs With Large Fluctuations
Slide 21 New Model Results: Major Biological Hotspot Caused by High Mercury Deposition from Local Sources Maximum deposition = 76 µg/m2-yr Evers et al. 2007.
Slide 22 How Significant are Local Emission Sources and What Role Do Coal-fired Power Plants Play? Tom Holsen, PhD Clarkson University
Slide 23 U.S. Total Mercury Emissions After EPA National Trends Inventory, 2006.
Slide 24 New Results Differ From EPA’s
Slide 25 How & Why Do These Results Differ? Deposition Our estimate = 13 - 76 µg/m2-yr (local and regional) 4-5 times higher than EPA estimates (all sources) Why? We used a local scale plume model and detailed Northeast emissions inventory. EPA used a larger scale grid model and coarse national emissions inventory. Implications Suggests finer resolution modeling is needed to characterize deposition patterns near large sources – even outside heavily industrialized regions.
Slide 26 New Model Results Highlight the Role of Coal-fired Power Plants in Hotspots Evers et al. 2007. Scenario: 90% emissions reductions from 4 coal-fired power plants Deposition After Evers et al. 2007.
Slide 27 Results Supported by Other Studies J. Keeler and Colleagues 1. Results in MI, OH, and VT show that EPA estimates of wet mercury deposition are 34-56% lower than measured values. 2. Steubenville, Ohio Study (Keeler et al. 2006) ~ 80% of wet mercury deposition is attributable to local/regional anthropogenic sources. ~ 70% is attributable to coal combustion.
Slide 28 Good News: Fish and Wildlife Can Respond Rapidly to Emissions Reductions Mercury air emissions from local upwind sources declined 45% from 1997 – 2002. 64% decline Adverse effect threshold After Evers et al. 2007.
Slide 29 Key Findings 1. Biological mercury hotspots do exist. 2. Specific hotspots linked to causes for the first time. 3. Airborne mercury emissions are the dominant source. 4. They produce a double-whammy in watersheds hit by decades of acid rain. 5. And cause ripple effects in reservoirs that are manipulated for power production. 6. New Hampshire case study demonstrates we’ve reached tipping point: coal-fired power plants have significant local impacts that are under-estimated by EPA. 7. Good news – document for first time in the Northeast that rapid recovery in fish and loons can occur if local emissions reduced. 8. Findings validate state concerns about mercury trading and need for new draft Federal legislation.