Download
1 / 23
250 likes | 329 Vues
Learn about descriptive and inferential statistics in SAS, including PROC FREQ, PROC UNIVARIATE, PROC TABULATE, Pearson chi-square, McNemar test, Fisher's exact test, logistic regression, and more. Discover how to analyze categorical data, interpret survey results, and answer important statistical questions.

E N D
Categorical data analysis: An overview of statistical techniques AnnMaria De Mars The Julia Group
Anyone who thinks he knows all of SAS is clinically insane Okay, Hemingway didn’t really say that, but he should have
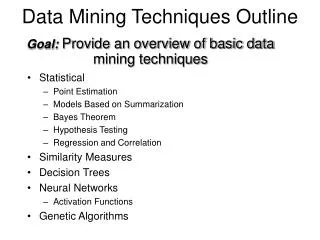
Three uses for descriptive statistics • Describe a sample • Check data quality • Answer descriptive questions
Descriptive Statistics PROC FREQ PROC UNIVARIATE PROC TABULATE ODS graphs SAS/Graph Graph – N- Go SAS Enterprise Guide
Basic Inferential Statistics Pearson chi-square McNemar Fisher
Answers to deep questions • What does a McNemar test test? • Why would a Pearson chi-square and a McNemar test give different answers?
Pearson Chi-Square • Tests for a relationship between two categorical variables, e.g. whether having participated in a program is related to having a correct answer on a test. • Assumes randomly sampled data • Assumes independent observations
Why is the previous example good? • It includes two independent groups • There are adequate numbers per cell
Enter the McNemar • This is a test of correlated proportions • It is commonly used to test, for example, if the proportion showing mastery at time 1 = the proportion showing mastery at time 2
Fisher’s exact test • Is used when the assumption of large sample sizes cannot be met • There is no advantage to using it if you do have large sample sizes
A lot more … • Cochran-Mantel- Haenszel test for repeated tests of independence • Do athletes in physical therapy report improvement in mobility more than those who do not receive PT and does this vary depending on if it is preseason or during the season ?
Other simple statistics • Binomial tests • Confidence intervals • Odds ratios Because, obviously, not everyone has the same tastes
What about logistic regression? • Logistic is similar to linear regression in that a dependent variable is predicted from a combination of independent variables • The dependent is the LOG of the ODDS ratio of being in one group versus another
Example: Death certificates • The death certificate is an important medical document. • Resident physician accuracy in completing death certificates is poor. • Participants were in an interactive workshop or provided printed handouts. • Pre-existing knowledge was measured
Example • Dependent: Cause of death medical student is correct or incorrect • Independent: Group • Independent: Awareness of guidelines for death certificate completion
Surveylogistic • Interpreted the same as the logistic output but allows inclusion of survey features such as strata and cluster
Other PROCs • CATMOD • CORRESP • PRINQUAL
Hybrids • T-test • ANOVA • NPAR1WAY • FACTOR • REG
It’s all about questions • Are your data any good? • What is the distribution of X ? • What is the distribution of X given Y? • Is there a significant relationship between X and Y? • Given X, what are the odds of Y? • How well, and with what variables, can we predict which category of X a person falls into? • Is this set of variables significantly better for predicting X than that other set of variables lying over there?
Our secret plan • Bivariate descriptives • Contingency, chi-square, probability • Other descriptives • Other simple statistics • Logistic regression