Models and Modeling
520 likes | 581 Vues
Explore the importance and types of models in system design such as mathematical, descriptive, and graphical models. Learn how modeling helps in communication, documentation, and system enhancement.

Models and Modeling
E N D
Presentation Transcript
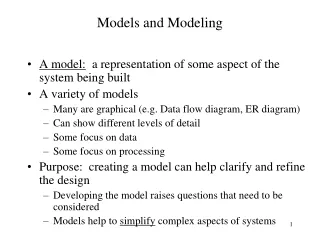
Models and Modeling • A model: a representation of some aspect of the system being built • A variety of models • Many are graphical (e.g. Data flow diagram, ER diagram) • Can show different levels of detail • Some focus on data • Some focus on processing • Purpose: creating a model can help clarify and refine the design • Developing the model raises questions that need to be considered • Models help to simplify complex aspects of systems
Reasons for Modeling • Learning from the modeling process • New pieces are found to be needed • New questions arise that need to be answered to complete the model • Reducing complexity by abstraction • Systems can be complex and intangible • Models of parts of the system help to clarify and focus on important aspects • Remembering all of the details • Models are a way of storing information for later use in a form that can be digested (e.g. A picture can say a lot)
Reasons for Modeling (cont.) • Communicating with other development team members • Can show others aspects of the system in a succinct way • Support communication – e.g. someone working on inputs and outputs can use the model to communicate with someone working on processing details • Communicating with a variety of users and stakeholders • Users need to see clear and complete models to understand what the analyst is proposing • Users often work with analyst to create models (this process can help users better understand what the system can do)
Reasons for modeling (cont.) • Documenting what was done for future maintenance/enhancement • Critical development team leaves behind a record of what was created • Need to package everything in a form future developers can understand and use when they modify and update the system • Much of the documentation consists of models (e.g. diagrammatic) as text mentions – also much of documentation also consists of textual reports
Types of Models • Mathematical model: a series of formulas that describe technical aspects of a system • Ex: R=r1, r2, ..., rn ; S= s1, s2, ..., sn ; there is a relation {(ri,sj) | ri єR sj є S } • Comfortable for scientific or engineering applications • Sometimes used in business systems – e.g. simple formula for payroll where you model gross pay as regular pay plus overtime pay • Descriptive model: narrative memos, reports, or lists that describe some aspect of the system • E.g. might jot down notes from interviewing a user • Users may describe what they do in reports or memos • Analyst can then convert these descriptions to a modeling notation
Types of Models (cont.) • Sometimes narratives are the best way for recording information • Simple lists of features, inputs, outputs, events or users are examples • A very important form of narrative model: writing a procedure in a very precise way – structured English or pseudocode • Pseudocode used a lot by programmers, can also be used to describe procedures during earlier phases Example of Pseudocode description of a payroll function: • Input the employees payroll data • If hours worked is greater than 40 then calculate overtime pay • Calculate gross pay for the employee - Gross Pay = hourly pay times 40 plus overtime • Calculate tax for the employee ETC.
Types of Models (cont.) • Graphical Model: diagrams and schematic representations of some aspect of a system • Easy to understand complex relationships (old saying: a picture is worth a thousand words) • Graphical models may look similar to a real-world part of the system (e.g. a screen design or report layout) • But often represent more abstract things, e.g. processes, data, objects, messages, connections • Key graphical models tend to represent abstract aspects of a system during Analysis Phase • The more concrete models (e.g. screen design) tend to appear later in the Design Phase
Notes on graphical models • Many different types and formats • Variations in notation • However, still based on basic symbols • Circle • Square • Rectangle • line
Models used in the Analysis Phase • The analysis phase named “Define System Requirements” involves creating models • logical models (define what is required without committing to one specific technology)
Models used in the Design Phase • These are physical models – since they will be implemented with a specific technology • Some are extensions of requirements models created during systems analysis • Some may be used during both analysis and design (e.g. object-oriented class diagram)
Events and System Requirements • Two key concepts to model: • Events • Things • Event – an occurrence at a specific time and place, that can be described and is worth remembering • E.g. customer placing an order, shipping identifies a backorder, nuclear reactor goes to meltdown • When defining system requirements it is useful to begin by asking what events occur that will affect the system being studied • What events will occur that the system will have to respond to? • Allows you to focus on external environment to keep you at high level view of system (not the workings of it)
Events (cont.) • Also allows you to focus on the interfaces of the system to outside people and systems • End users can easily describe system needs in terms of events that affect their work, very useful when working with users • Gives a way to divide (or decompose) the system requirements so you can study subsystems separately (complex systems need to be decomposed based on events)
Background to Event Concept • Structured analysis adapted to real-time systems in the early 1980’s • E.g. process control system, reactors, aerospace etc. • Events like “chemical vat is full”, “boiler overflowing” • System must respond to these types of events immediately • Extended to business applications since they have become more interactive
Types of Events • External Event • An event that occurs outside the system • usually initiated by an external agent or actor (a person or organization that supplies or receives data from the system) – Can also be another software !! • Classic example of an external agent: a customer • Possible event: the customer wants to place an order • Naming events: • Include the external agent in the name • E.g. events: “Customer places order”, “Management checks order status”,”Customer reports change of address”
External Events Checklist • External agent wants something resulting in a transaction • External agent wants some information • Data changed needs to be updated • Management wants some information • Temporal Events • An event that occurs as a result of reaching a point in time • Could be reports to management generated regularly • System automatically produces reports etc. at right time (so no external agent needed) • E.g. Payroll systems produce a paycheck every two weeks (or once a month)
Temporal Events Checklist • Internal outputs needed • Management reports (summary or exception) • Operational reports (detailed transactions) • Internal statements, documenbt (including payroll) • External outputs needed • Statements, status reports, bills, reminders • State Events • An event that occurs when something happens inside the system that triggers the need for processing • E.g. the sale of a product results in an adjustment in the inventory (event “Reorder point reached) • This state change might occur as a result of external events or to temporal events (so could be similar to temporal event, but point in time can’t be defined)
Identifying Events • Events versus conditions and responses • Can be difficult to distinguish between an event and the sequence of conditions that lead to it (e.g. events leading to buying a shirt) • Also may be hard to distinguish between an external event and the system’s response (e.g. customer buys shirt, system requests credit card number – the customer buying the shirt is the event) • Way to determine if an occurrence is an event • Ask whether any long pauses or intervals occur (I.e. is the system at rest for another transaction to complete? Once a transaction starts there are no significant stops till done
Tracing the Sequence of Events • It is often useful to trace the sequence of events for a specific external agent or actor
Technology-Dependent Events and System Controls • System controls: checks for safety procedures necessary to protect the integrity of the system • Logging on to a system (for security reasons) • Controls for keeping integrity of a database • To help decide which events apply to controls we assume that technology is perfect (never the case!) • During analysis we should focus on events that are required under “perfect” conditions -- “perfect technology assumption” • It is during design phase that we deal with other issues and events from a “non-perfect world” point of view, e.g. events like “Time to back up the database”, Login etc
External Events for the Rocky Mountain Outfitters Customer Support System Look at all the people and organizations that want the system to do something: • Customer wants to check on item availability • Customer places an order • Customer changes or cancels order • Customer or management wants to check order status • Shipping fulfills orders • Shipping identifies back order • Customer returns item • Prospective customer requests catalog • Customer updates account information • Marketing wants to send promotional materials to customers • Management adjusts customer charges (corrects errors) • Merchandising updates catalog • Merchandising creates special product promotion • Merchandising creates new catalog
Temporal Events for the RMO Customer Support System Look at all the regular reports and statements that the system must produce at certain times: • Time to produce order summary reports • Time to produce transaction summary reports • Time to produce fulfillment summary reports • Time to produce prospective customer activity reports • Time to produce customer adjustments/concession reports • Time to produce catalog activity reports
Looking at Each Event • Event Table: A table that lists events in rows and key pieces of information about each event in columns • The trigger: an occurrence that tells the system that an event has occurred (either the arrival of data needing processing or of a point in time) • The source: an external agent or actor that supplies data to the system • The activity: behavior that the system performs when an event occurs • The response: an output, produced by the system, that goes to a destination • The destination: An external agent or actor that receives data from the system
“Things” • In addition to modeling events, we have to model the “things” that the system needs to store information about • E.g. products, orders, invoices, customers etc. • In traditional approach, these things make up the data which the system stores information about • In the object-oriented approach these things are objects
A way to identify “things” of interest • The analyst can identify types of things by thinking about each event in the event list and asking what types of things are affected that the system needs to know about • E.g. when a customer places an order we need to know about the following • The customer • The items ordered • Details about the order e.g. date and payment terms
Relationships among Things • Relationship: a naturally occurring association among specific things • An order is placed by a customer and an employee works in a department • “Is placed by” and “works in” are two relationships • Relationships apply in two directions • A customer places an order • An order is placed by a customer • Important to know the number of associations of things – I.e. the cardinality (or multiplicity) of the relationship • E.g. one to one, one to many • It is also important to know the range of possible values of the cardinality • Zero to many (optional relationship), one to one, and one to many (mandatory relationships)
Types of relationships • Binary relationship • Relationship between two different types of things • E.g. between a customer and an order • Unary (recursive) relationship • Relationship between two things of the same type • E.g. one person being married to another person • Ternary relationship • A relationship between three different types of things • E.g. one order associated with a specific customer plus a specific sales representative • n’ary relationship • A relationship between n (any number) different types of things
Attributes of Things • Attribute: one piece of specific information about a thing • E.g. a customer has a name, phone number, credit limit etc. (these are attributes of a customer) • Compound attribute: an attribute that contains a collection of related attributes – E.g. a full name is made up of first and last name • Identifier (key) – an attribute that uniquely identifies a thing E.g. a person’s social insurance number (?), or an invoice or transaction number)
Data Entities and Objects • Data entities • For the traditional approach, those are things the system needs to store information about. Modeled as boxes in the ER diagram) • Computer processes interact with these data entities • Entities are things like customers and order • Objects – the other way to look at things • Similar to data entities in traditional approach • BUT the objects do the work in the system, they do not just store information (i.e. They have behavior) • This difference has important effects on system modeling
Objects • Class: the type or classification to which all similar objects belong (e.g. guitar and violin objects both belong to class “stringed instruments”) • Classes, associations among classes and attributes of classes are modeled using a class diagram • Attribute:Store information (data) about the class, e.g. • Costumer: name:string, ID:integer,Married:boolean • Method: the behaviors all objects of the class are capable of • A behavior is an action that the object processes itself, when asked to do so E.g. ask a boiler object to check its water level by sending it a message • Encapsulation: covering or protecting each object so that it contains values for attributes and methods for operating on those attributes (making the object a self-contained and protected unit)
The Entity-Relationship Diagram • Used in traditional approach • Emphasizes data storage • Data entities • Their attributes • Relationships among data entities • Model used to define data storage • Entity-relationship diagram (ERD)
ERD Notation • Rectangles: data entities • Lines connecting rectangles: relationships
Order Customer 1 0..n Place
Order 3 March 31 Order 2 March 5
Notes • As an analyst works on a model, the ERD gets refined • E.g. many-to-many relationship • May lead to storing additional data
Problem: where is the grade each student receives for a course going to be stored? • Other refinements may be needed • Database normalization