Download
1 / 55
550 likes | 739 Vues
Fabrizio Cei INFN and University of Pisa - Italy BVR PSI, 17 February 2010. Status of MEG Physics Analysis. Outline. Results of physics analysis of 2008 data . Present status of physics analysis : - summary of physics analysis for individual sub-detectors ;

E N D
Fabrizio Cei INFNandUniversityofPisa- Italy BVR PSI,17 February 2010 Status of MEG Physics Analysis Fabrizio Cei
Outline • Resultsofphysicsanalysisof 2008 data. • Present status ofphysicsanalysis: - summaryofphysicsanalysisforindividual sub-detectors; - observationof radiative decayevents in MEG 2009 data; • Perspectivesfor 2009 data analysis. Fabrizio Cei
2008 Data Analysis Fabrizio Cei
RD RD RD RD RD RD 2008 run: 1014m+ stopped in target We also took RMD data once/week at reduced beam intensity Programmed beam shutdowns Air test in COBRA Cooling system repair Fabrizio Cei
Pre-selection/blinding windows Plane (Eg, Dt) used for pre-selection + reconstructed track with associated TC hit Blinded files: 0.2 % events Open files: 16 % events Pre-selection process repeated several times with improving calibrations and algorithms. Final blinding box: 1 ns around zero(timing offset subtracted). Fabrizio Cei
fS/fMis obtained by generating and reconstructing large samples of MC events (for signal and Michel) in various configurations to take into account the DCH instabilities TRG = 22: Michel events trigger (only DCH track required) TRG = 0: MEG events trigger Normalization 1) where: 107pre-scaling factor Fabrizio Cei
Normalization 2) Final Value k = 4.7∙1011 ±10% Independent computation k = 4.9∙1011 ± 10% 2 k = 1/”SES”(not exactly a “SES”: not zero bck) Advantage of this technique: it uses the MEASUREDnumber of Michel positrons instead of the CALCULATED number of stopping muons/second it is independent of time varying DCH acceptance and efficiency. Result confirmed by computations based on time-averaged acceptance and efficiency. Fabrizio Cei
Generalities on analysis • Three independent blind-likelihoodanalyses. • RD and accidental event rates in the signal region fitted or estimated a priori by means of side-bands information. • Feldman-Cousins method for C.L. determination. • Kinematical variables used: - Positron and Gamma Energies; - Relative timing and relative angle; • Likelihood function: Signal PDF RD PDF Nobs = number of observed events Accidental BCK PDF Fabrizio Cei
Analysis: PDF determination 1) Signal: Gamma Energy from p0 (DRS) or MC taking into account resolution (TRG); Positron Energy: 3 gaussian shapes; sigma’s extracted from Michel positron fit; Positron-Photon relative angle: toy MC based on experimental angular resolutions of positrons and photons; Positron-Photon relative timing: gaussian shape with sigma = 147 (or 135) ps from radiative decay data fit with Gamma Energy outside of Blinding Box. Radiative Decay: Gamma Energy + Positron Energy + Relative Angle e+-g: 3-D distribution based on theoretical shape folded with detector response (correlations); Relative Timing e+-g: gaussian shape with sigma = 147 (or 135) ps as for signal. Fabrizio Cei
Analysis: PDF determination 2) Accidental bck: fit of Gamma Energy, Positron Energy and Relative Angle for events falling in DT “side bands” |DTeg| > 1 ns Gamma Energy Accidental radiative decay + Positron Annihilation in flight + resolution + pileup Important point: the PDF of the most dangerous background can be measured ! Fabrizio Cei
Sensitivity evaluation • Expected sensitivity evaluated with two methods: • Toy MC assuming zero signal(two independent calculations): • - generated 1000 independent samples of events using bck and RD pdf’s; • - upper bound on number of signal events evaluated for each sample; • - average upper bound @90% C.L: 6 events • - average upper bound on B.R.(m → eg) = 1.3 x 10⁻¹¹. • Fit to events in the sidebands: • - applied same fitting procedure used for data in the signal region; • - upper bound: B.R.(m → eg) (0.9 2.1) x 10-11. • Comparison: present upper bound from MEGA experiment: 1.2 x 10⁻¹¹ Fabrizio Cei
Likelihood analysis Results in close agreement from the three analyses. Fit in the signal region • Checks: • Number of RD events in • agreement with predictions • and extrapolations from • sidebands; • Test of C.L. extraction • with bayesian technique; • Fits using TRG instead of • DRS information and • different DT computation • algorithms; • Fit to DT only (sensitive • to signal + RD). Fabrizio Cei
Eg vs Ee+ 103 MC events Cut at 90% efficiency on other variables (relative angle and relative timing) Fabrizio Cei
B.R.(m → eg) 90 % C.L. limit From the 90 % C.L. upper bound on number of signal events: NSig 14.7 we obtained the corresponding 90 % C.L. upper limit: BR(m+→ e+g) 2.8 x 10⁻¹¹ 2 times worse than the expected sensitivity. The probability of getting this result by a statistical fluctuation of the observed distributions is (3 5) % (Bad Luck !) Results available atarXiv:0908.2594. Paper to be submitted soon. Fabrizio Cei
Present status ofphysicsanalysis Fabrizio Cei
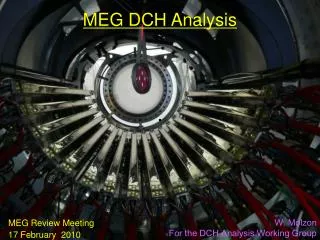
DCH Severalquantitiestobecalibrated: • Common timing offset (t0); • Relative timing between end ofwires ( r); • Anode and padscharges ( z). Standard calibrationscompleted and implemented. Alternative calibrations/algorithmsunder way to: • Check the originofnotyetadequate performancesbymeansofindependentcodes; • Trytoimprovesuchperformances. Alignmentcheckbycosmicraysmeasurements. Fabrizio Cei
DCH standard calibrations: z anodes Sizeof pad pitch Fabrizio Cei
DCH standard calibrations: z pads Vertical offset Cathode Hood Fabrizio Cei
Low Track Statistics Channels with sync Offsets Low Gain (T_end0 –T_end1) vs wire Relative timing betweenendsofwires not calibrated (Time_end0 – Time_end1) vs Wire calibrated The relative offsets of the calibrated data show a double peak. Since, this double peak structure comes about after calibration, it’s good indication that there is a pattern in the leading edge fits, or, first peak remained while deviant data points populated second peak. Under investigation. Ch’s with sync problems Shows relative offsets before and after calibration. The RMS of the not calibrated data seems to be dominated by deviant wires. Fabrizio Cei
Alternative algorithms/calibrations Integrationbased on trapezoidalmethod T (ms) Fiteachseparated chargeindependently as a functionof z Fabrizio Cei Z extrapolatedfromtrack
Single hit Z resolution Double gaussianfit |DZ| > 0.3 cm cm |DZ| > 0.3 cm score = 480 mm, core fraction = 0.722, mean -35 mm (asymmetric tail) Fabrizio Cei
Comparisonofperformances Allthesenumbers wereobtained byusing the double-turnmethod theymustbe dividedbysqrt(2) sf 9 ÷ 11 mrad sq 15.5 ÷ 17 mrad sP 0.51 ÷ 0.61 MeV Numbers in parentheses () are RMS ofdistributions. Fabrizio Cei
Preliminaryanalysisofcosmicray data Tracksfittedby 3-D straightlines. Computed R and Z distanceoftrack fromnominal position ofeachchamber. Mean R -440 micron Mean Z -190 micron Analysis in progress Chamber Chamber IMPROVED, Startingpoint fornewiteration. Chamber Chamber Fabrizio Cei
DCH: coherentnoise • The remaining noise is more “white” then before • RMS reduced from 2.7 mV to 1.2 mV – more then twice • This is just an example, dominated frequency are visible in almost all WFs • Possible tool to improve Z resolution Low frequency ( 13 MHz) noise; more visible on pads. Can befittedwith a single or doublesinusoidalshape and subtracted Fabrizio Cei
DCH: MC studies Usual way ofmeasuring the angular resolution (double turn method) gives a systematicallyworseresultthan the differencewrttruevalue (2÷3 mradshift). Resolutionforsignaleventsisbetterthan for Michel events. 3 2 3 2 1 1 • Angularresolutiondepends on Z • resolution, butnotdramatically; • Toobtain a 15 mradangular • resolutiononeshouldusean • abnormally bad valuesZ = 3 mm. 1: 300 micron, single gaussian 2: 470 micron, single gaussian 3: doublegaussian Fabrizio Cei
DCH: present situation sq = 12.7 mrad sZ = 3.1 mm ≥ 8 hits, TC+DCH match as in 2008 50 MeV < E < 54 MeV sf = 8.1 mrad sR = 2.4 mm Fabrizio Cei
DCH: Comments Comparisonbetween MC and presentlevelofanalysis (all in mrad): Data (2-turn) MC (2-turn) MC (true) Michelq 12.7 10.5 8 Signalqnotavail. 8.67 Michelf 8.1 8.0 7 fulfilled ! Signalfnotavail. 7.16.5 Centralcolumnisour goal ! Nottoo far, butseveralpossibleactions … • Refinesingle hit Z calibrations; • Check the hit reconstruction/pattern recognition/trackingalgorithms; • Check the database; • Refinecomparisonswith MC (numberofhits, inefficiencies, materials …); • Improve CR data analysis misalignmentcorrections, survey…. • Subtractcoherentnoise; • Understand and correctothereffectswhich can deteriorate the resolution (cross talks, chamberbreathing …) Fabrizio Cei
Timing Counter • Severalcalibrations: - TimeWalkwith triple events intrinsic bar resolution; - z-offset; - effectivevelocity(under way); - timing calibrationwith MEG (Michel) and Dalitz events inter-bar and Teg(Boronforcheck); • Allconstants in the database. Fabrizio Cei
Timing Countercnt. Bar instrinsicresolution Intrinsicresolutionis a bit worse than in 2008. Studies under way to figure out the originof the discrepancies. However, (70 ÷ 100) ps isstill acceptable. MEG Data. Z offset calibration with Michel events Fabrizio Cei
Timing Countercnt. Fabrizio Cei
Timing Counter: Comments • TC barsstableduring 2009 data taking; • TC resolutions look a bit worsethan in 2008; • Weexpectsome improvementsfrom the next re- processing (better TC-DCH match; more accurate determinationofcalibrationconstants …); • Some calibrations are under refinement (effective light velocity, inter-bar timing …); • MC studiesofDalitzeventstodisentangle the contributionoftracklengthuncertainty; • …. Fabrizio Cei
XenonCalorimeter • Calibrationchainalmostcompleted: • LED/Gainvariationwithtime; • Q.E.determinationbyalpha data in liquidXenon(in 2008: gaseousXenon); • Uniformitycorrections; • Pedestaldetermination(CEX-mdifference); • Timing constantsfortwodifferentalgorithms; • Full implementation in the database under completion; • Everythingreadybefore the next re-processing (sometimes in March). • Checks: • Uniformityof CW lineenergy; • Linearity. • Results: • Energy resolutionwithp0; • Background spectrum. Fabrizio Cei
XenonCalorimetercnt. Gaindecreasecorrection 10% decrease • Effectoffirst QE set. • Furtherrefinements • under way toprecisely • match the calorimeter • opticalproperties: • reflections • Rayleighscattering … 3.3 % Fabrizio Cei
XenonCalorimetercnt. Linearity curve determinedbyusingp0. CW points look displacedby 1% (under study). Uniformityof17.6 MeV CW Li peak. Eachpointrepresents the reconstructed position of the Li peak in a 3-D spatialbin. Fabrizio Cei
XenonCalorimetercnt. CEX energyresolution (FWHM) as a functionoftime. Purplelineobtained byinsertingpedestalfluctuations in MEG runs. supper = 2.0% in a 2x2 PMTsgrid (usual 1x1); 1.95% forcollimator #8. Background spectrum. Fitwith a combinationofRD+AIF (Green), and Pile-up (Blue). - Resolution just a bit worsethan in 2008; - Energy scale notexactly 1becauseof a mistake in configurationparameters (data tobereprocessed). Fabrizio Cei
XenonCalorimeter: Comments • Calibrationchainused in 2008 looksadequate. • Work in progress forfurtherimprovements (i.e. Q.Edetermination); • Energy resolution a bit worsethan in 2008, butanalysis work stillpreliminary. Nevertheless, 5% FWHM goal in energyresolutionalreadyfulfilled. • Timing resolutionrequiresfurtherefforts: - single PMT timing extraction; - boardscalibration/synchronization; - …. • First background energyspectrumpreliminary PDF. Fabrizio Cei
RMD observation 1) Three independentanalyses, withdifferentcuts or no cuts at all. Peakwellvisibleabove background withoutneedofrefinedsearches. Allbars Single bar s = 209 ps Offset subtracted, butmeandisplacedby 300 ps Fabrizio Cei
RMD observation 2) RMD signalstablealong the data takingperiod. In 2008 the signalbecame less and lessvisible becauseof the reduced DCH efficiency. • Pre-selectionwindowneedstobere-centered. • Resolutionis some tensof ps worsethan at the end of 2008 • (XEC/TIC calibrationconstants ? tracking ? Tobeaddressed) Fabrizio Cei
Perspectivesfor 2009 data analysis Fabrizio Cei
2009 Data Sample Short run, but very smooth Improved tracking and trigger efficiency 6.5 x 10¹³muons stopped in the target preliminary Fabrizio Cei
Perspectivesfor 2009 data 1) Withrespectto 2008 the startingconditionsofour analysis are generallybetter: - Xenoncalorimeterstable at predicted light yield; - stablebehaviourof DCH; onlyfewchannelsnotworkingproperly; - higher trigger efficiency 88% becauseofbetter direction match LUT. The analysisschemeweplantouseissimilartothatof 2008, whichallowedto produce our first paper: - 2 ÷ 3 complete reprocessing, startingfromwaveforms (< 2 weeks per each); - some ( 5) reprocessingofpre-selected data (fewdays per each); - pre-selection/selection/blinding windows toberefined. Fabrizio Cei
Perspectivesfor 2009 data 2) A strong calibrationeffortis under way on all sub- detectors, based on the first data processing. - Calibrationconstantsstilltobeoptimized; - However, resolutionsclosetothatobtained last year atthe end ofanalysischain; - DCH angularresolutionsalreadybetterthan in 2008; continuousoptimization work by a dedicatedworkinggroup; - Possibleimprovementsbyalignmentcheck; - Xenoncalorimeterenergyresolution at 5% FWHM level; - Improvements in timing resolutionexpectedfrom DRS timing calibration; Selections and cutstobeoptimizedtoreach the best compromise betweenresolutions/background rejection and efficiency. Algorithmsforfinalanalysis (i.e. likelihood) welltested on 2008 data. A detailed job listwithtimeschedule willbepreparedas in 2008 ! Fabrizio Cei
Physicsanalysisschedulefor 2009 ICHEP2010 (submission) ICHEP2010 Feb Mar Apr May Jun Jul Finalize Calibrations/resolutions Final reprocessing Next reprocessing(s) Reprocessing BG Estimation Open box Final analysis Normalization Systematics Update Various checks of final result Fabrizio Cei
Performance Summary measured in sigma Fabrizio Cei
2009 Expected Sensitivity • Estimate by means of toy MC simulation/Feldman-Cousins. • Updated resolutions and data statistics in table • NBG in analysis window estimated by scaling NBG in analysis window in 2008 • A little narrower analysis window (signal efficiency x 0.95) • NBG expected in analysis window: 435 • NBG in (old) 90% signal box: 1.1 • Results: • Average Nsignalupper limit: 6.9 • Average BR upper limit: 6.6×10⁻¹² • 6.9 × (2.0 × 10-12)/2.2/0.95 2008 sensitivity in analysis window Improvement in data statistics wrt 2008 Fabrizio Cei
Expected Sensitivity for 2010 or later • Estimate by means of Poisson statistics/Feldman-Cousins • Updated resolutions and data statistics in table • NBG in signal box is estimated by the PDF probability ratio. • Asymmetric 90%-efficiency signal box to optimize S/N (same efficiency but less BG) • Results • 2010 (stat. ratio to 2008: 11.4) • S.E.S.: 4.0 × 10⁻¹³ • NBG: 0.9 • UL: (4.0 × 10⁻¹³ ) × 3.2 = 1.3 × 10⁻¹² • 2010 + 2011 + 2012 (stat. ratio to 2008: 11.4 + 13.4 + 13.4) • S.E.S.: 1.2 × 10⁻¹³ • NBG: 3.0 • UL: (1.2 × 10⁻¹³ ) × 4.41 = 5.3 × 10⁻¹³ Fabrizio Cei
Backup slides Fabrizio Cei
Analysis cuts Positron • Track quality cuts (minimum number of hits and chambers, good chi2 for fit …); • Selection of track with best pattern recognition; • Track timing determined by position matching between DCH and TC; • Elliptical cuts on target and beam spot at COBRA centre. • (Already used to evaluate normalization factor by means of Michel positron events) • Cosmic ray rejection based on front/back charge ratio on the LXe calorimeter; • Fiducial volume cut for photons; • Pile-up identification in the LXe calorimeter and photon energy correction; • Collinearity cut on photon-positron relative angle; • 50 MeV < Ee < 56 MeV; • 46 MeV < Eg < 60 MeV; • |Dteg| < 1 ns; • Multiple algorithms and two independent digitizers for photon energy/timing checks ! Photon and photon-positron correlation Fabrizio Cei
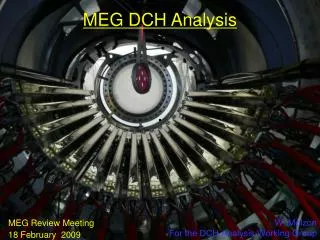
3-D view of a MEG event Photon Trajectory Positron Track Hits in XEC Hits on DCH Hits on TC Fabrizio Cei
Events in signal region vs pdf’s Positron Energy Gamma Energy Gamma Positron Angle Distributions normalized to the total number of events Black: real events Red:signal pdf Blue:RD pdf Green:accidental pdf Fabrizio Cei