Download
1 / 26
260 likes | 376 Vues
This presentation focuses on quantifying the impacts of hydromodification on landforms and the processes influencing them, highlighting the importance of geomorphology. It discusses modeling geomorphic impacts through both qualitative and quantitative approaches, assessing changes in hydrology, channel geometry, bed and bank material strength, and sediment supply. Various mitigation strategies, including out-of-stream and in-stream options, are presented to address existing geomorphic impacts and prevent future ones. This framework aims to promote effective hydromodification management to protect our waterways.

E N D
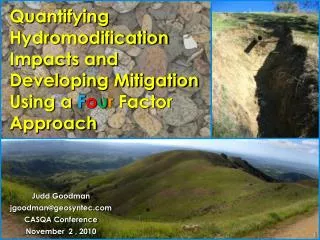
Quantifying Hydromodification Impacts and Developing Mitigation Using a FourFactor Approach Judd Goodman jgoodman@geosyntec.com CASQA Conference November 2 , 2010
Objectives What is geomorphology? Why should I care about it? How are geomorphic impacts modeled? ) f( Δhydrology, Δchannel geometry, Δbed & bank material strength, Δsediment supply = Geomorphic Impact
What is geomorphology? Geomorphology = the scientific study of landforms and the processes that shape them Fluvial = of, relating to, or occurring in a river or stream GeomorphicImpact = Changes in landforms and the processes that shape them. Often caused by land use change. Restoration vs. Hydromod Management prevent a future geomorphic impact fix an existing geomorphic impact
Why care about geomorphology? Example of geomorphic impact: Judd flow flow flow flow 17-ft 140-ft ~290 acre watershed Hydromod! 300-ft Post-Development Pre-Development 4 Images from GoogleEarth Include watershed changes and outfall undermining
How are geomorphic impacts modeled? Qualitative: QsD50αQwS Lane (1955) ) f( Δhydrology, Δchannel geometry, Δbed & bank material strength, Δsediment supply Quantitative: Geomorphic Impact = Source: Rosgen (1996), From Lane, 1955. Reprinted with permissions
Δhydrology Hydrologic Models are applied to simulate the hydrologic response of catchments under pre- and post-developed conditions for a continuous period of record. flow • Hydrologic Inputs: • Rainfall • Catchment Delineation • Soils • % Imperviousness • Lag Time • In-stream Infiltration • Evapotranspiration Post-Urban Discharge Pre-Urban Time
Δhydrology Flow output from hydrologic model is used to generate flow duration curves. Currently Hydromodification Management focuses on State of the practice is flow-duration matching. Δhydrology
Δchannel geometry Cross-sections and longitudinal profiles of the active channel are surveyed at strategic locations during the geomorphic field assessment. flow Plan View
Δbed & bank material strength For each cross-section surveyed, a measure of critical shear stress is obtained on the bed and bank material. • Non-cohesive bed: • Wolman Pebble Count • and/or Sieve Analysis • Cohesive bed and bank: • Jet Test • or Characterize using Tables • Vegetated bank: • Characterize using Tables
Δsediment supply Sediment yields are calculated using a GIS raster based analysis. Sediment generated from developed land and areas tributary to detention facilities are removed in the post-project condition. % Sed Reduction = [ Yield (pre) - Yield (post) ] Yield (pre) Sediment Yield Map
Model Summary Rainfall, Catchment Delineation, Soils, % Imperviousness, Lag Time, In-stream Infiltration, Evapotranspiration Hydrologic Model Flow Duration Curve Hydraulic Model Channel Geometry Stage, Shear stress, Velocity Transport Model Bed & Bank Material Strength Ratio of Transport Work/ Transport Statistical Model Sediment Supply Reduction Ratio of Sed Supply Probability of Geomorphic Impact
Estimating Geomorphic Impact Step 1: Stage, effective shear stress, and flow velocity are computed using flow duration and channel geometry data as inputs to a hydraulic model. Work for Consolidated Material: Step 2: Stage, effective shear stress, flow velocity, and critical bed / bank material strengthare then input into the applicable work or sediment transport equation and summed over the period of record.
Estimating Geomorphic Impact Step 3: Ratio of Transport is calculated by comparing relative changes in total work/transport capacity in the pre- and post-development conditions: Transport post Transport pre
Estimating Geomorphic Impact Step 4: Sediment supply loss is accounted for by reducing the baseline Ratio of Transport by the Ratio of Sediment Supply to that computation point. Sediment Supply post Target Ratio of Transport = Sediment Supply pre Step 5: For each cross-section location the Ratio of Transport is compared to the Ratio of Sediment Supply (Target Ratio) to get a Probability of Instability. Study in Bay Area: Ratio of Transport (Target = 1.0)
Statistical Relationship Santa Clara Valley HMP Ratio of Transport • 40 Cross Sections: • Thompson Creek • Ross Creek • San Tomas Creek
Out-of-Stream Mitigation Rainfall, Catchment Delineation, Soils, % Imperviousness, Lag Time, In-stream Infiltration, Evapotranspiration Hydrologic Model Flow Duration Curve Hydraulic Model Channel Geometry Stage, Shear stress, Velocity Transport Model Bed & Bank Material Strength Ratio of Transport Work/ Transport Statistical Model Sediment Supply Reduction Ratio of Sed Supply Probability of Geomorphic Impact
Out-of-Stream Mitigation Route post-development runoff through flow duration control facilities to mimic pre-development hydrology. Detention Basin Bio-Retention
In-Stream Mitigation Rainfall, Catchment Delineation, Soils, % Imperviousness, Lag Time, In-stream Infiltration, Evapotranspiration Hydrologic Model Flow Duration Curve Hydraulic Model Channel Geometry Stage, Shear stress, Velocity Transport Model Bed & Bank Material Strength Ratio of Transport Work/ Transport Statistical Model Ratio of Sed Supply Sediment Supply Reduction Probability of Geomorphic Impact
In-Stream Mitigation Reduce longitudinal slope with in-stream grade control structures to mimic pre-development work/sediment transport. Goal: Conserve Transport
Project Solution? • Equilibrium Slope = 0.2% may not be feasible to construct. • Outfall structure needs to be retrofit to properly dissipate energy. • Opportunity for combined flow control and grade control mitigation.
Rainfall, Catchment Delineation, Soils, % Imperviousness, Lag Time, In-stream Infiltration, Evapotranspiration Hydrologic Model Thank You! Questions? Flow Duration Curve Hydraulic Model Channel Geometry Stage, Shear stress, Velocity Transport Model Bed & Bank Material Strength Ratio of Transport Work/ Transport Statistical Model Ratio of Sed Supply Sediment Supply Reduction Probability of Geomorphic Impact f( ) Δhydrology, Δchannel geometry, Δbed & bank material strength, Δsediment supply = Geomorphic Impact