Microsoft Excel 2010
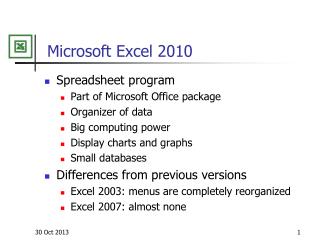
Microsoft Excel 2010. Spreadsheet program Part of Microsoft Office package Organizer of data Big computing power Display charts and graphs Small databases Differences from previous versions Excel 2003: menus are completely reorganized Excel 2007: almost none. Cells. Work-book

Microsoft Excel 2010
E N D
Presentation Transcript
Microsoft Excel 2010 • Spreadsheet program • Part of Microsoft Office package • Organizer of data • Big computing power • Display charts and graphs • Small databases • Differences from previous versions • Excel 2003: menus are completely reorganized • Excel 2007: almost none
Cells • Work-book • Work-sheets, cells • Cells • References, columns and rows • Name box and formula bar • Sheet tabs • Autocalculate • Sheet operations • Right-click Insert… • Right-click Rename • Right-click Tab Color… • Right-click Move or Copy…
Types • Numbers’ formats • File Options Advanced Editing options • Types • Home Numbers • Value • Formula (begins with =) • Text (use ‘ to convince Excel)
Types • Value (aligned to the right) • Number: 23 or 56,45 or -0,4 or ,23 or (24) • Currency: €34,2 or 9€ or 0,7 € • Date: 3 Mar or 7/10/05 or Jun 2005 or 3-5 • Time: 2:34 am or 17:28 • Percentage: 34,5% • Formula • Everything which begins with = • Text (aligned to the left) • Everything else: alphanumeric characters and symbols
Data entry suggestions • Use the cells format dialog box before typing values! • Pay attention to what Excel understands, especially dates! • Pay special attention when converting between numbers and percentages! • 0,02 2% • 2 200% • 0,56 % 0,0056
Autotasks • Autofill • drag • Repeat the same value • Increment the value • When not satisfied of Excel behaviour: • CTRL + drag
Importing data • Home Clipboard Paste • Paste Value • Paste Special… • Data Get External Data From Text • Fixed fields • Delimited fields
Formula • Choosing the cells • Cell pointing with mouse • Cell name with keyboard • Operations • Mathematical operations: + - * / ^ • Parenthesis • Errors • #DIV/0! Division by zero • #NAME? Wrong cell name • #REF! Wrong cell reference • #NULL! Function’s arguments missing or too many • #NUM! Wrong number in a function or too large number • #VALUE! Wrong type in a function
Formula references • Relative A1 • Dragging the formula • Absolute $A$1 • Partial absolute $A1 A$1 • F4
Formulas Function Library Warning: names are language dependent! Use the conversion table if studying in other languages • Math & Trig • SQRT, EXP, PI, LN, LOG • ROUND, ROUNDDOWN, ROUNDUP • ABS, RAND, RANDBETWEEN • MAX, MIN, SUM, AVERAGE • SUMIF, COUNTIF, AVERAGEIF
Functions • Logical • IF(test; value if true; value if false) • AND is ( ) * ( ) , OR is ( ) + ( ) • NOT • Text • LEN • RIGHT, LEFT, CONCATENATE, REPT
Slide only for ISDM5Date functions • Date & Time • NOW, TODAY • WEEKDAY • Serial number format and +/- operations • Date exact calculation • DAY, MONTH, YEAR • DATE • DATEDIF (the undocumented function)
Slide only for ISDM5Financial functions • Financial • net present value • XNPV • internal rate of return • XIRR • Loan • T.A.N. Tasso AnnualeNetto (Yearly Net Rate) • T.A.E.G. Tasso AnnualeEffettivoGlobale (Yearly Real Global Rate)
Slide only for ISDM5Mortgage loan • constant payments and constant interest rate • PMT, IPMT, RATE, NPER • adjustable interest rate • Must build the table • Constant payments and adjustable length • Adjustable payments and constant length
Functions • Statistical • AVERAGE, VAR.S, STDEV.S • NORM.DIST, NORM.INV • Multiple sheets references • sheetname!A1 • [filename.xls]sheetname!A1
Data Data Tools What-If Analysis • Goal Seek… • Scenario Manager… • Add • Summary • Assigning cell’s name • Data table… • Select entire table • One parameter: Column input cell • Two parameters
Solver example • My profession is writing books and giving seminars. • Each book requires 300 working hours and I earn 15000 euro. • Each seminar requires 20 working hours and I earn 10000 euro. • I want to maximize my earnings. The obvious choice would be to give as many seminars as possible. • However, in order to be called by universities for seminars I need to write at least one book every year! • Moreover, I have further constraints: • I do not want to work more than 1600 hours per year • I must give at least 4 seminars per year in order to advertise my books • I have only 18000 euro funding and each book uses 500 euro, while each seminar uses 2500 euro • How to maximize my earnings satisfying my constraints?
Solver • File Excel Options Add-Ins Go Solver • Solver – Risolutore • Write variables, possibly using cell names • Write objective and constraints • Data Analysis Solver • set variables (Variablenzellen, Celle variabili) • set objective (Ziel, Obiettivo) • set constraints (Nebenbedingungen, Vincoli) • set constraints for integer and binary variables • Solve (Lösen, Risolvi) • Answer report (Antwort, Valori)
Printing • Page Layout Page Setup • Page • Orientation • Scaling • Margins • Center on page • Header/Footer • Sheet • Print area: • Print Gridlines • ViewWorkbook ViewsPage Break Preview • File Print
Document formats • Portable Document File .pdf • PDF advantages • Adobe Acrobat Reader and Adobe Acrobat • File Print choose printer Adobe PDF • Alternative ways to produce PDFs • Protecting documents with Adobe Acrobat • Tools Security Encrypt with Password • Excel document .xlsx • Excel 97-2003 document .xls • Plain Text .txt .csv
Automatic format • Home Styles Format as Table • My table has headers • Design Table styles Clear • Data Filter • HomeStyles Conditional Formatting • Apply a rule which looks good • Manage rules… Edit Rule… • Reverse Icon order
Chart building • Select cell range • Insert Charts • Choose chart type and subtype • Chart Tools Design • Data Switch Row/Column • Data Select Data Add/Edit • Chart Layouts • Chart Styles • Location
Chart Tools Layout • Current Selection • Plot Area/Horizontal Axis/Vertical Axis • Format Selection • Insert • Shapes/Text Box • Labels • Chart Title/Axis Title/Legend/Data Labels • Axes • Axes/Gridlines
Chart types • Multiple selection: CTRL + mouse • 1 data series • Columns and bar plots • Line and Area (not a math graph!) • Pie • Multiple data series • Stacked columns and bar plots • Stacked lines and stacked area • Scatter (only tool for mathematical graphs)
Extra • InsertIllustrationsShapesInsert Shapes • Non trasparent text box with arrow • Sheet protection except some cells • Review Changes • Allow Users to Edit Ranges New • Protect Sheet…
Extras • Hide and unhide • HomeCellsFormatVisibilityHide & Unhide… • right-click Hide/Unhide… • Split and freeze pane • Put cursor in the top left of the lower pane • View Window Freeze Panes • Review Comments New Comment
Extras • List (small database) • Data Sort • Add Field • Data Filter • Hyperlink • Select area, right-click Remove Hyperlink • File Options Proofing Autocorrect Options… Autoformat as you type
PivotTable • Select well-structured cells • Insert Tables PivotTable • Drag items from PivotTable Field List • Left-click Value Field Settings • Filter • Sort • Options Group Field • Options Tools PivotChart
Statistics with Excel Add-ins • File Excel Options Add-Ins Go Analysis ToolPak • Analyse-Funktionen – Strumenti di Analisi • Data Analysis Data Analysis • Descriptive Statistics (Popolationskenngrößen) • Histogram • Right-click Format Data Series No Gap • Bin range (Klassenbereich)