Hypothesis Tests
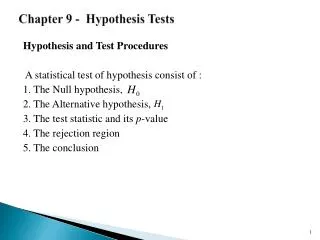
Hypothesis Tests. In statistics a hypothesis is a statement that something is true. Selecting the population parameter being tested (mean, proportion, variance, ect.) Using p-values for hypothesis tests Using Critical Regions for hypothesis tests One tailed vs. two tailed tests.


Hypothesis Tests
E N D
Presentation Transcript
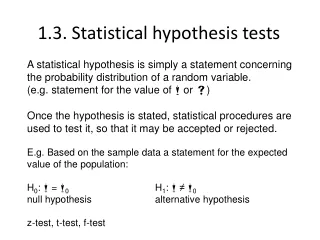
Hypothesis Tests In statistics a hypothesis is a statement that something is true. • Selecting the population parameter being tested (mean, proportion, variance, ect.) • Using p-values for hypothesis tests • Using Critical Regions for hypothesis tests • One tailed vs. two tailed tests
Hypothesis Tests In a hypothesis test: • Identify H0 and HA • Select a level of significance • Assume the null hypothesis is true • Take a sample and determine the probability of that occurring. This is called the p-value. • Reject or Fail to reject H0
Errors in Hypothesis Tests A type I error is when one rejects the null hypothesis when the null hypothesis was true. The probability of a type I error is the significance level A type II error is when one fails to reject the null hypothesis when the null hypothesis was false. The probability of a type II error is denoted
Example Suppose that you are a lawyer that is trying to establish that a company has been unfair to minorities with regard to salary increases. Suppose the mean salary increase per year is 8%.
Example Suppose that you are a lawyer that is trying to establish that a company has been unfair to minorities with regard to salary increases. Suppose the mean salary increase per year is 8%. You set the null and alternate hypothesis: H0: HA:
Example Suppose that you are a lawyer that is trying to establish that a company has been unfair to minorities with regard to salary increases. Suppose the mean salary increase per year is 8%. You set the null and alternate hypothesis: H0: HA: What is a type I error? What is a type II error? Always express these in terms of the problem.
Example Type I: You accuse the company of wrong doing when they are innocent. Type II: You let the company get away with discrimination. As we decrease the probability of a type I error by changing the significance level, we increase the chance of a type II error.
Small Samples Up until now all the hypothesis test examples have involved large samples (e.g. n>30). What a company such as BMW? They test how many kilometers (on average) their new cars can travel before needing to be repaired. Each test is very expensive so the company does not want to test 30 cars.
What a company such as BMW? They test how many kilometers (on average) their new cars can travel before needing to be repaired. Each test is very expensive so the company does not want to test 30 cars. When testing fewer than 30 objects, you need to use a t-statistics (the same as with confidence intervals). Hence, we need to find the degrees of freedom (n - 1) and use the t-table and assume the original population is normally distributed.
Example Is the temperature required to damage a computer on the average less than 110 degrees? Because of the price of testing, twenty computers were tested to see what minimum temperature will damage the computer. The damaging temperature averaged 109 degrees with a standard deviation of 3 degrees. (Use )
Population Proportion We have seen how to conduct hypothesis tests for a mean and we now give some attention to proportions. The process is completely analogous. We use the z-score (for large samples) and we will need to use the standard deviation formula for a proportion. E.g.
Example A survey of 835 male youth showed that 401 were from single family homes. Can we conclude that more than 45% of ll male youth are from single family homes. Use level of significance 0.05
Example A survey of 835 male youth showed that 401 were from single family homes. Can we conclude that more than 45% of ll male youth are from single family homes. Use level of significance 0.05 State the research and null hypotheses Sketch the rejection region Compute the test statistic State your conclusion and give the p-value.
Example The CEO of a large electric utility claims that at least 80 percent of his 1,000,000 customers are very satisfied with the service they receive. To test this claim, the local newspaper surveyed 100 customers, using simple random sampling. Among the sampled customers, 73 percent say they are very satisfied. The lawyers for the newspaper says to avoid a law suit they can accuse the CEO of misrepresentation if they are 97% certain she is wrong. Should they print the story?
Example - Two tailed The CEO of a large electric utility claims that exactly 80 percent of his 1,000,000 customers are very satisfied with the service they receive, but has a reputation for just making up data. To test this claim, the local newspaper surveyed 100 customers, using simple random sampling. Among the sampled customers, 73 percent say they are very satisfied. The lawyers for the newspaper says to avoid a law suit they can once again accuse the CEO of misrepresentation if they are 97% certain she is wrong. Should they print the story?What if the lawyer had said 95%?