Analyzing Survey Results and Regression Test to Determine Relationship
This unit discusses hypothesis tests for sample size effects using survey data from Valesky and Brown. It explores confidence intervals and significance tests, determining the relationship between variables using regression analysis.

Analyzing Survey Results and Regression Test to Determine Relationship
E N D
Presentation Transcript
Effect of sample size • Valesky vs. Brown: Both surveys below say 54% for V., so for CI, EV of sample % is .54. And for sig test: H0: p = 0.5, Ha: p > 0.5. • n = 100: For CI, SE = √[.54(.46)/100] = .05, so 54% ± 10%. For sig test, SE = √[.5(.5)/100] = .05, so P(% ≥ .54) = P(z ≥ (.54-.5)/.05 = .8) = 21% • n = 1600: For CI, SE = √[.54(.46)/1600] = .0125, so 54% ± 2.5%. For sig test, SE = √[.5(.5)/1600] = .0125, so P(% ≥ .54) = P(z ≥ (.54-.5)/.0125 = 3.2) = .07%
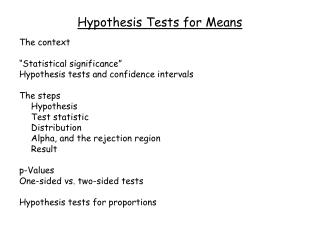
Sgn test: Are x,y really related? • Regression line for data in sample approximates the regr line for population: y = α + βx , where α, β are the intercept and slope for the population. • Are population x,y really related, i.e., is β ≠ 0? • Sgn test: H0: β = 0, t = √[n-2]∙r/√[1-r2], df = n-2 • Some statisticians, like our authors, disapprove of this test. (SigT4Slope.ods)
Example: H0: β = 0 t = √[4-2] (.434)/ √[1-(.434)2] ≈ .681 , df = 4-2 = 2 P(t ≥ .681 or ≤ -.681) is not less than 5%, so we fail to reject the null hypothesis: x and y are not related.