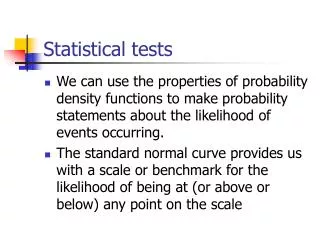
Statistical Hypothesis Tests
Statistical Hypothesis Tests. Notes of STAT6205 by Dr. Fan. Overview. Introduction of hypotheses tests ( Sections 7.1,7.2 ) General logic Two types of error Parametric tests for one mean and for proportions What is the best test for a given situation? Order Statistics (Section 8.3)


Statistical Hypothesis Tests
E N D
Presentation Transcript
Statistical Hypothesis Tests Notes of STAT6205 by Dr. Fan 6205
Overview • Introduction of hypotheses tests (Sections 7.1,7.2) • General logic • Two types of error • Parametric tests for one mean and for proportions • What is the best test for a given situation? • Order Statistics (Section 8.3) • Wilcoxon tests (Section 8.5) 6205
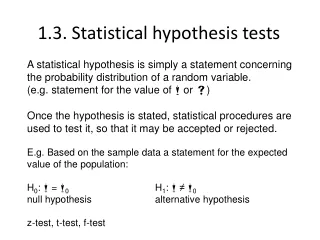
Statistical Hypotheses • A statistical hypothesis is an assumption or statement concerning one or more population parameters. • Simple vs. composite hypotheses E.g. A pharmaceutical company wants to be able to claim that for its newest medication the proportion of patients who experience side effects is less than 20%. Q. What are the two possible conclusions (hypotheses) here? 6205
Hypothesis Tests • A statistical test is to check a statistical hypothesis using data. It involves the five steps: • Set up the null (Ho) and alternative (H1) hypotheses • Find an appropriate test statistic (T.S.) • Find the rejection (critical) region (R.R.) • Reject Ho if the observed test statistic falls into R.R. and not reject Ho otherwise • Report the result in the context of the situation 6205
Determine Ho and H1 • The null hypothesis Ho is the no-change hypothesis • The alternative hypothesis H1 says that Ho is false The Logic of Hypothesis Tests: “Assume Ho is a possible truth until proven false” Analogical to “Presumed innocent until proven guilty” The logic of the US judicial system Q: What are the two possible conclusions? 6205
Determine Ho and H1 Golden Rule: Ho must be a simple hypothesis. Practical Rule: If possible, the hypothesis we hope to prove (called research hypothesis) goes to H1. Back to the drug example, setting Ho and H1. 6205
Types of Errors H0 true H0 false Type II Error, or “ Error” Good! (Correct!) we accept H0 Type I Error, or “ Error” Good! (Correct) we reject H0
More Terms • a= Significance level of a test = Type I error rate • Power of a test = 1-Type II error rate=1- b • We only control a not b, so we don’t say “accept Ho”. 6205
Report the Conclusion • Reject Ho: the data shows strong evidence supporting Ha Eg. The data shows strong evidence that the proportion of users who will experience side effects is less than 20% at significant level of 10%. • Fail to reject Ho: the data does not provide sufficient evidence supporting Ha Eg. Based on the data, there is not sufficient evidence to support the proportion is less than 20% at significant level of 5%.
Tests for One Mean 6205
Z Test For normal populations or large samples (n > 30) And the computed value of Z is denoted by Z*. 6205
Types of Tests 6205
Types of Tests 6205
Types of Tests 6205
Example 1 (Conti.) Conduct a test for Ho: mu=2500 vs. H1: mu =3000 at 5% significant level. • What is the R.R.? • What is the power of the test? Z test is the most powerful test! 6205
P-Values • The p-value is the smallest level of significance to reject Ho at the observed value, also called the observed significance level. p-value > a fail to reject Ho p-value <a reject Ho (= accept Ha) • That is, p-value is the probability of seeing as extreme as (or more extreme) what we observe, given Ho is true.
P-Value • The level of significance (called a level) is usually 0.05 • p-value > a fail to reject Ho (??) • p-value <a reject Ho (= accept Ha)
Computing the p-Value for the Z-Test P-value = P(|Z| > |z*| )= 2 x P(Z > |z*|)
t Test • For normal populations with unknown s Eg. Revisit Example 1
Testing Hypotheses about a Proportion • Three possible Ho and Ha Write them all as p=po in the future
The z-test for a Proportion • When 1) the sample is a random sample 2) n(po) and n(1-po) are both at least 10, an appropriate test statistic for p is
Example: New Drug (Conti.) • Ho: p > 20% vs. Ha: p < 20% • Z-test statistic; a = 0.05 • Find rejection region or p-value • Decide if reject Ho or not • Report the conclusion in the context of the situation
Hypothesis Test for the Difference of Two Population Proportions • Step 1. Set up hypotheses Ho: p1 = p2 and three possible Ha’s: Ha: p1 = p2 (two-tailed) or Ha: p1 < p2 (lower-tailed) or Ha: p1 > p2 (upper-tailed)
Hypothesis Test for the Difference between Two Population Proportions • Step 2. calculate test statistic where
Hypothesis Test for the Difference between Two Population Proportions • Step 3: Find p value • Must be two independent random samples; both are large samples: And • When the above conditions are met, use Z-Table to find p-value. • Steps 4 and 5 are the same as before
Example: Bike to School For 80 randomly selected men, 30 regularly bicycled to campus; while for 100 randomly selected women, 20 regularly bicycled to campus. • Find the p-value for testing: Ho: p1 = p2 vs. Ha: p1 > p2 Answer: z=2.60, p=0.0047 1: men; 2: women
Order Statistics • Min & Max • Joint and other orders 6205
Order Statistics Problem 1: Suppose X1, X2, …, X5 are a random sample from U[0,1]. Find the pdf of X(2). Problem 2: Suppose X1, X2, …, Xnare a random sample from U[0,1]. Show that X(k)~ beta(k,n-k+1). 6205
Order Statistics The CDF of X(k)and example 6205
Wilcoxon Tests Ho: median of X = median of Y vs. H1: Ho is false Wilcoxon tests (p. 448 - 450) • assume the two distributions are of similar shapes but do not need to be normal • See the supplementary material 6205
Exercise 8.5-9 X = the life time of light bulb of brand A Y = the life time of light bulb of brand B Data: (in 100 hours) X: 5.6 4.6 6.8 4.9 6.1 5.3 4.5 5.8 5.4 4.7 Y: 7.2 8.1 5.1 7.3 6.9 7.8 5.9 6.7 6.5 7.1 • Conduct the Wilcoxon test at 5 % level to test if brand B has longer life time in general. A: W(Y)=145 > 128 or Z= 3.024 > 1.645; reject Ho • Construct and interpret a Q-Q plot of these data. 6205
R Code for Q-Q Plot > x<-c(5.6, 4.6, 6.8, 4.9, 6.1, 5.3, 4.5, 5.8, 5.4, 4.7) > y<-c(7.2, 8.1, 5.1, 7.3, 6.9, 7.8, 5.9, 6.7, 6.5, 7.1) > qqplot(x,y,xlab="life time of brand A", ylab="life time of brand B", main="qqplot of Life time of Brand A vs. Brand B") 6205