Statistical Tests
Statistical Tests. Data Analysis. Statistics - a powerful tool for analyzing data 1. Descriptive Statistics - provide an overview of the attributes of a data set. These include measurements of central tendency (frequency histograms, mean, median, & mode) and

Statistical Tests
E N D
Presentation Transcript
Data Analysis Statistics- a powerful tool for analyzing data 1.Descriptive Statistics- provide an overview of the attributes of a data set. These include measurements of central tendency (frequency histograms, mean, median, & mode) and dispersion (range, variance & standard deviation) 2.Inferential Statistics- provide measures of how well your data support your hypothesis and if your data are generalizable beyond what was tested (significance tests)
The Population: =5.314 Population size = 500
The Population: =5.314 The Sample: 7, 6, 4, 9, 8, 3, 2, 6, 1 mean = 5.111
The Population: =5.314 The Sample: 1, 5, 8, 7, 4, 1, 6, 6 mean = 4.75
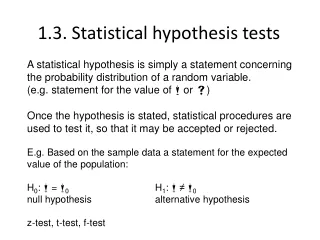
Parametric or Non-parametric? •Parametric tests are restricted to data that: 1) show a normal distribution 2) * are independent of one another 3) * are on the same continuous scale of measurement •Non-parametric tests are used on data that: 1) show an other-than normal distribution 2) are dependent or conditional on one another 3) in general, do not have a continuous scale of measurement e.g., the length and weight of something –> parametric vs. did the bacteria grow or not grow –> non-parametric
The First Question After examining your data, ask: does what you're testing seem to be a question of relatedness or a question of difference? If relatedness (between your control and your experimental samples or between you dependent and independent variable), you will be using tests for correlation (positive or negative) or regression. If difference (your control differs from your experimental), you will be testing for independence between distributions, means or variances. Different tests will be employed if your data show parametric or non-parametric properties. See Flow Chart on page 50 of HBI.
Tests for Differences • Between Means - t-Test - P - ANOVA - P - Friedman Test - Kruskal-Wallis Test - Sign Test - Rank Sum Test • Between Distributions - Chi-square for goodness of fit - Chi-square for independence • Between Variances - F-Test – P P – parametric tests
Null Hypothesis Alternative Hypothesis Y Y A B C A B C Differences Between Means Asks whether samples come from populations with different means There are different tests if you have 2 vs more than 2 samples
Differences Between Means – Parametric Data t-Tests compare the means of twoparametric samples E.g. Is there a difference in the mean height of men and women? HBI: t-Test Excel: t-Test (paired and unpaired) – in Tools – Data Analysis
A researcher compared the height of plants grown in high and low light levels. Her results are shown below. Use a T-test to determine whether there is a statistically significant difference in the heights of the two groups
Differences Between Means – Parametric Data ANOVA (Analysis of Variance) compares the means of two or more parametric samples. E.g. Is there a difference in the mean height of plants grown under red, green and blue light? HBI: ANOVA Excel: ANOVA – check type under Tools – Data Analysis
A researcher fed pigs on four different foods. At the end of a month feeding, he weighed the pigs. Use an ANOVA test to determine if the different foods resulted in differences in growth of the pigs.
Differences Between Means – Non-Parametric Data The Sign Test compares the means of two “paired”,non-parametric samples E.g. Is there a difference in the gill withdrawal response of Aplysia in night versus day? Each subject has been tested once at night and once during the day –> paired data. HBI: Sign Test Excel: N/A
Differences Between Means – Non-Parametric Data The Friedman Test is like the Sign test, (compares the means of “paired”, non-parametric samples) for more than two samples. E.g. Is there a difference in the gill withdrawal response of Aplysia between morning, afternoon and evening? Each subject has been tested once during each time period –> paired data HBI: Friedman Test Excel: N/A
Differences Between Means – Non-Parametric Data The Rank Sum test compares the means of two non-parametric samples E.g. Is there a difference in the gill withdrawal response of Aplysia in night versus day? Each subject has been tested once, either during the night or during the day –> unpaired data. HBI: Rank Sum Excel: N/A
Differences Between Means – Non-Parametric Data The Kruskal-Wallis Test compares the means of more than two non-parametric, non-paired samples E.g. Is there a difference in the gill withdrawal response of Aplysia in night versus day? Each subject has been tested once, either during the morning, afternoon or evening –> unpaired data. HBI: Kruskal-Wallis Test Excel: N/A
Differences Between Distributions Chi square tests compare observed frequency distributions, either to theoretical expectations or to other observed frequency distributions.
Differences Between Distributions E.g. The F2 generation of a cross between a round pea and a wrinkled pea produced 72 round individuals and 20 wrinkled individuals. Does this differ from the expected 3:1 round:wrinkled ratio of a simple dominant trait? HBI: Chi-Square One Sample Test (goodness of fit) Excel: Chitest – under Function Key – Statistical E Frequency E Wrinkled Smooth
Differences Between Distributions E.g. 67 out of 100 seeds placed in plain water germinated while 36 out of 100 seeds placed in “acid rain” water germinated. Is there a difference in the germination rate? HBI: Chi-Square Two or More Sample Test (independence) Excel: Chitest – under Function key - Statistical Alternative Hypothesis Null Hypothesis Proportion Germination Proportion Germination Plain Acid Plain Acid
Correlation Correlations look for relationships between two variables which may not be functionally related. The variables may be ordinal, interval, or ratio scale data. Remember, correlation does not prove causation; thus there may not be a cause and effect relationship between the variables. E.g. Do species of birds with longer wings also have longer necks? HBI: Spearman’s Rank Correlation (NP) Excel: Correlation (P)
Question – is there a relationship between students aptitude for mathemathics and for biology?
Regression Regressions look for functional relationships between two continuous variables. A regression assumes that a change in X causes a change in Y. E.g. Does an increase in light intensity cause an increase in plant growth? HBI: Regression Analysis (P) Excel: Regression (P)
Correlation & Regression Looks for relationships between two continuous variables Alternative Hypothesis Null Hypothesis Y Y X X
Is there a relationship between wing length and tail length in songbirds?
Is there a relationship between age and systolic blood pressure?