Analyzing Plant Tissue Lengths in Sucrose Solutions: Data Collection and Statistical Analysis
This document details the methodology and results of a study examining the effects of various sucrose concentrations on the lengths of potato (Solanum) and apple (Malus) tissues. It emphasizes the importance of accurate data recording and processing, including the use of descriptive titles in data tables, recording of measurements with consistent precision, and inclusion of qualitative observations. Statistical methods such as t-tests and standard deviation calculations are described for processing and analyzing the collected data, ensuring insights into the significant differences in tissue responses.


Analyzing Plant Tissue Lengths in Sucrose Solutions: Data Collection and Statistical Analysis
E N D
Presentation Transcript
Recording Data & Statistical Tests IB Biology 2009-2010
Recording RAW Data • Be sure all data tables have • DESCRIPTIVE TITLE • Not “the results” or “data” • Include some mention of methodology • If handwritten, use ruler to draw gridlines • Units and error recorded in heading of table • ALL measurements recorded to the same level of precision ) watch decimal places • Include qualitative data observed during the investigation
“Complete” Table 1: Lengths of two plant tissues, potato (Solanum) and apple (Malus) after soaking in solutions of sucrose of different concentrations. The initial lengths were 4.0 cm. It was also noticed before the soaking that the potato tissue floated in the solution from 0.4 to 1.0 mol. The apple tissue, however, only floated in the solutions from 0.6 to 1.0 mol. After soaking the tissues became softer at higher sucrose concentrations but they were quite hard in the lower concentrations.
Processing Data • Processing means mathematical calculation has occurred • Means are most common method for recording data in Biology • Other formulas may be used (rate, change, % change, stoichiometry, etc) • Show sample calculation (except mean) • Don’t forget units and error • Mean can’t be more precise than raw data • Use standard deviation as SEM when means used • Make NEW data table for processed data for clarity • You want DATA TABLE AND GRAPH • Graph PROCESSED DATA!!!!!
Standard Deviation • The standard deviation is a statistic that tells you how tightly all the various examples are clustered around the mean in a set of data. • 68% fall +/- 1 • 95% fall +/- 2 • 99% fall +/- 3
Standard Error • The standard error of the mean • This statistic gives us an idea of how “good” our sample is. The narrower the limits are the closer the mean of the sample represents the mean of the population • The standard error of the mean is given by • Its size indicates how representative your mean is.The sample mean ± • gives the 95% confidence limits. • In other words, we are 95% sure that the mean of the population lies somewhere between: • NB We would only use this formula for n>30. If n<30 and we are fairly sure the population we are sampling from has normal distribution we replace 1.96 by the 95% point from our t-test tables with n-1 degrees of freedom.
Calculating Standard Deviation • EXCEL – use built in function
Calculating Standard Deviation • TI-83/84 • Enter data into List in STAT menu • Use STAT CALC • Select “1:1-Var Stats” • Type L1 (or list used)
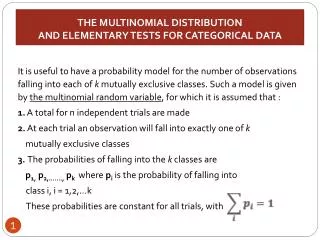
The t-test • Used to determine if two sets of data are significantly different • Paired t-test (same subjects receive both treatments) • Unpaired t-test (compares two groups, but individuals in groups are different)
Null and Alternate Hypotheses • Null Hypothesis • There is no significant difference between the results of the two groups • The treatment HAD NO effect • Alternate Hypothesis • There IS a significant difference between the results of the two groups • The treatment HAD an effect • This is usually the hypothesis we stated in lab
Level of significance (p-value) • p-value indicates the probability that the differences between the two groups is due to chance • If p<.05 then we reject the null hypothesis (test supports the alternate hypothesis) • If p>0.05, we cannot reject the null hypothesis (note wording)
t-test in excel • In Excel the t test is performed using the formula: =TTEST (range1, range2, tails, type) • For the examples you'll use in biology, tails is always 2 (for a "two-tailed" test), and type can be 1 or 2 depending on the circumstances. • Type 1 = paired • Type 2 = unpaired
Type 2 – unpaired test • Number of WBC in infected vs uninfected patients
Type 1 – paired test • Pulse rate measured before and after eating
Paired T-test on TI-83/84 Pulse Rate (+/- 1 BPM) before and after 100 mg caffeine consumption • [STAT] [1]; cursor to L1 column heading, press [CLEAR] [ENTER], and enter the “Before” numbers. • Cursor to L2 column heading, press [CLEAR] [ENTER], and enter the “After” numbers. You want to get the column of differences, After−Before, That’s the same as L2−L1, which is the formula for L3. • Cursor to L3 column heading. Enter the formula, [2nd 2 makes L2] [−] [2nd 1 makes L1] [ENTER]. • NOTE – you need to make print data table with these differences and means.
Paired t-test, cont’d • Use 1 VAR Stats to get mean and std dev • [STAT] [►] [1] for 1-VarStats, then [2nd 3 makes L3]. • Since the sample statistics are automatically pasted to the t test screen, you don’t need to copy them. Just enter the μ (hypothesized mean/difference) and the “>” from your H1.[STAT] [◄] [2] for T-Test Enter 0 for μo. Skip past x̄, s, and n. Enter >μo (since you hypothesize caffeine increases HR), then select CALCULATE or DRAW. In this case, p< 0.05, so the null hypothesis is rejected… the alt hyp that caffeine increases HR is supported
Showing work using TI-83/84 • Write what you entered in each list • Record stats for mean and SD • State t-test statistic and p-value • State what this info “tells” you
UNPAIRED t-test on TI-83/84 USE this test when populations samples aren’t the same individuals • Select 2-SampTTest • Enter mean, sample size (n) and SD for each sample • Select appropriate alt hypothesis • Selected POOLED data • Calculate results • Note, in thiscase p>0.05 • Null hypothesisNOT rejected • NO sig difference intwo samples
Problem #1 • As a biochemist working for a pharmaceutical company, your job is to test new drugs for possible side effects, both deterimental and beneficial. The chemistry of agent TFK-05W suggests that it may have the side effect of reducing the tendency toward obesity. The Zucker rat is an established genetic model for both obesity and hypertension. As rats of the obese strain age they gain weight much more rapidly than do the so-called "lean" Zucker strain. You plan to treat a group of animals over a period of one year and compare their average weight with that of a group of untreated animals. • The odds of the drug actually showing this side effect are small and maintenance of rats for a year is expensive, so you limited the scope of the study to twelve animals in each group. The null hypothesis is that treated animals will show an average weight gain over one year that is no different from the average weight gain of untreated animals. What statistical test will you use to compare the two means?
Answer • You'll run a t test for independent samples. It doesn't matter that the number of animals in each data set is the same, nor that they are all the same type of animal. You sampled 12 treated individuals and 12 different untreated individuals. There is no special relationship between a data point from one group and any particular data point from a second. The sampling method was independent.
Problem #2 • This study follows from problem #1. Not only did your study suggest that the agent TFK-05W indeed does affect weight gain, but it also proved effective and safe (so far) and it is in clinical trials. Because the drug was designed to treat symptoms that have nothing to do with obesity, the clinical trials do not focus on that problem and won't answer the question of whether or not the agent is a potential weight loss drug. The company, however, has permitted you to test the agent on a group of 12 people with morbid obesity, who have signed the appropriate consent forms. • This time the plan is to treat the 12 obese individuals for a year, having measured their weights on the day treatment was started. The paid participants will be monitoring their weight regularly, taking the drug, and are required to keep a daily log of activity and eating habits so that the experiment can be properly controlled. Nevertheless, the simplest initial test of the hypothesis that obese individuals treated with TFK-05W for a year will show an average weight loss is to compare average weight at the beginning and end of the experiment. Thus, as with problem #1, you will have two sets of 12 data points each to compare. What statistical test will you use to compare the two means?
Answer • This study calls for running a paired t test. The same individuals were sampled (weights measured) at the beginning and at the end of the study. Thus each data point in the first set can be paired with a data point from the same individual in the second set. • Variability among distinct individuals contributes considerable experimental error to many experiments. Such error can mask effects, especially small effects, even if the null hypothesis is indeed false. For example, if the average individual lost 10 pounds but the standard deviation at the beginning of the experiment was 55 pounds, the loss might not show up as a significant difference. By controlling for individual variability the paired t test can focus on the average change in weight.
Problem #3 • Embryonic cells (stem cells) from a single human blastula are genetically equivalent. Any of them has the potential to form any kind of tissue that is normally found in an adult human body. Exploitation of stem cells for therapeutic purposes has the potential to revolutionize medicine and expand the average human lifespan considerably. Stem cells have very complex cultural requirements. So far your stem cell lines require the addition of fetal bovine serum to the culture medium, and the exact composition (and efficacy) of animal sera varies from lot to lot, To exercise the greatest control over your experiments, it would be valuable to be able to culture your cells in a synthetic medium that includes only those components that are essential to support survival and growth of your cultures. • You have developed a synthetic medium that keeps your cells going for several days, but not indefinitely. You think that you can extend the life of your cultures by adding an expensive hormone to the medium. To test the hypothesis that stem cells cultured with medium 2 will survive longer than stem cells cultured with medium 1, you will set up twenty cultures from ten original embryos, growing them in complex medium to the point at which each culture contains about 100 cells. You will then remove the original medium and feed the cultures from now on with synthetic medium. One culture from each original embryo will receive medium 1 and the other medium 2. For your data you will record the time at which each culture declines to the point of having only 50% of its original viable cells remaining. The null hypothesis is that this average "survival time" will be the same for cultures treated with either synthetic medium. Alternative hypotheses, of course, are that feeding with one or the other medium will enhance survival time by comparison. • What statistical test will you run on the two sets of 10 data points each?
Answer • This case can be thought of as a set of replicate experiments. In each experiment one culture from a single source was fed one medium and a second culture from the same source was fed the other medium. The experiment was replicated 10 times, using 10 different sources. Since each replicate experiment consists of a pair of data points linked by the common origin of the respective cultures, you have a set of 10 pairs of data (two sets of paired data). • A paired t test is appropriate for the same reasons it was appropriate for problem #2. The paired method controls for experimental error that might be contributed by the 10 different sources. • Why not conduct all of the replicate experiments on cultures from a single source, eliminating all experimental error that is contributed by individual variability? Then we run the risk that the result won't hold for cultures from other embryos. We want to know if the medium we are testing will work for most or all cultures, not only for cultures from one particular embryo.
Problem #4 • You suspect that a cause of decline of your stem cell cultures is a failure to produce sufficient superoxide dismutase to rid the cells of oxygen free radicals. You have an assay for the enzyme, but to conduct the assay you must destroy the culture. From a single source of stem cells you can prepare about thirty cultures that remain healthy about 10 days in your synthetic medium after growing to a sufficient number of cells to permit you to run your assay. From then on, they decline rapidly. • You prepared thirty cultures from the same source and sampled half of them when alll thirty cultures had reached the point at which the assay was feasible. You then sampled the other half 10 days later. Your null hypothesis is that superoxide dismutase activity will not be significantly different between the two sets of cultures. What statistical test will you run to determine whether or not the difference is significant? • Normally, this would be a rather poor experimental design, because all of the cultures are identical. Why conduct replicate sampling on the exact same culture? The issue is that enzyme assays are notoriously inaccurate. The chances of mulitple comparisons yielding dubious results are much smaller than for a single comparison. The p value that we obtain will give us a fairly accurate estimate of the level of confidence with which we can interpret the result.
Answer • This time your samples are all coming from the same population of cultures, presumably all identical except that half of them were sampled at one time and half at the other time. All of the data points are linked by the fact that they were obtained from cultures from a common source. However, there is no special one to one correspondence between any one data point in one set and a unique data point in the other. There is no basis for a paired t test, so we must run a test for independent samples. • The assay itself is the variable in this example. If the assay was 100% accurate and reliable, we would only have needed one sample at each time. On the other hand, any significant difference should be considered preliminary until the experiment can be repeated on at least one or two more sets of cultures.
Problem #5 • Referring to problem #1, one of your rats died of natural causes during the study, leaving 11 animals in one group while you still had 12 animals in the other. Does this turn of events ruin the experiment? If you do conduct the analysis, how will you modify it, if at all?
You lost one animal, but because each data set represents an independent sample it is not necessary that the numbers of data points be equal. You conduct the t test for independent samples, comparing a set of 11 data points with a set of 12.
Problem #6 • Referring to problem #2, one of your human subjects died of a massive heart attack halfway through the study. The death was clearly not related to the drug treatments. Please answer the same questions as for problem #5.
This time you lost both data points that were to be contributed by the deceased individual. You now have 11 data points in each set. It shouldn't be a problem unless the others start dropping off as well.
Problem #7 • In problem #2 it was stated that Zucker rats treated with the agent TFK-05W were significantly less obese than untreated rats. Does this mean that when the t test was run it returned a probability (p) value of > 0.05 or a p value of < 0.05?
P would be <.05 • The p value is the probability that the null hypothesis is accurate. The higher the p value, the greater is the probability that there is no significant difference between means. A probability of 0.05 (1 in 20 chance) or less is considered sufficient evidence on which to reject the null hypothesis. Rejecting a null hypothesis means we accept an alternative. The result with the Zucker rats was that the treated group weighed less, so we accept the alternative hypothesis that the drug reduced weight gain. The other alternative, which was not supported by the data, would be that the drug caused additional weight gain. • Of course, working with probabilities there is always a chance that the results of an experiment are simply wrong. Realistically, though, experimental results are seldom wrong due to an improbable distribution of samples. They are usually wrong because of a bad experiment, especially when an experiment is not well controlled.
Problem #8 • For the third problem the difference between means was 12 hours, that is, the average half life of one culture was 12 hours longer than the average half life of the other one. The t test returned a p value of 0.33. What is your conclusion regarding the original hypothesis? • Would you be correct in stating that the result is significant or insignificant?
p > 0.05 so don’t reject H0 • The difference in sample means may have been 12 hours, but apparently there was enough variability among cultures that the difference was not significant. With p > 0.3 it is unlikely that you will get a significant difference even by testing more cultures. • Unless a difference is supported by probability it is not considered significant at all. Think about it. Maybe the range over which cultures lasted was quite wide. Perhaps the difference in sample means would be reduced to zero or even reduced if you just switched two data points. • You would not be correct to say that the result is insignificant. The result is that medium 2 has no apparent effect on longevity of a culture, and that finding is indeed significant. The difference in means was insignificant, not the result itself.
Problem #9 • In problem #4, average superoxide dismutase activity was 30% lower after 10 days than it was in the beginning. The t test gave a p value of 0.07. What result do you report? It turns out that this study is very important, and if you indeed find that a decline in superoxide dismutase activity is a primary cause of cell death then good things will happen to your career. How will you proceed from this point?
Repeat, but don’t falsify results • With a p value of 0.07 you are so close to finding a significant difference that it is sorely tempting to drop a data point in favor of your hypothesis, or maybe "round off" to 0.05. Scientific integrity requires that you treat the data as they stand, however. You do not have sufficient evidence with which to reject the null hypothesis. • How to proceed? Because it is so important to you that you come to a conclusion, an appropriate course of action is to repeat the experiment. Analysis will be more complicated because the second experiment will be conducted on a different set of cultures. To keep it simple you could repeat the experiment twice and if the results are consistent, pool all of the data points. By the way, with 45 data points in each set you probably would no longer need a t test. You could base your analysis on the normal distribution and simply look at overlap between standard deviations in order to determine a p value.