Download
1 / 67
670 likes | 703 Vues
This presentation discusses the importance of monitoring instructional effectiveness in grades 1-3 to guide school-level initiatives and improve classroom instruction. It focuses on the goals of Reading First and the measures of success, as well as the key components of effective instruction and assessment that raise literacy levels. Lessons learned from the Kennewick school district in Washington are also highlighted.

E N D
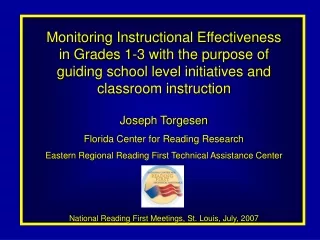
Monitoring Instructional Effectiveness in Grades 1-3 with the purpose of guiding school level initiatives and classroom instruction Joseph Torgesen Florida Center for Reading Research Eastern Regional Reading First Technical Assistance Center National Reading First Meetings, St. Louis, July, 2007
The most important Reading First goals: 1. Increase the percentage of students reading “at grade level” each year at each grade level from kindergarten through third grade 2. Decrease the percentage of students with serious reading difficulties each year at each grade level Our most important measures of success in doing this assess student performance on reading comprehension measures at the end of the year-particularly at end of third grade
Whether or not we achieve these goals depends on the strength of our instruction to accomplish two things during the year All students who begin the year meeting grade level expectations continue to meet grade level expectations at the end of the year-they make expected yearly growth All students who begin the year reading below grade level accelerate their development so they make expected yearly growth plus catch-up growth
Whether or not we achieve these goals depends on the strength of our instruction to do two things during the year Insuring all students make expected yearly growth Strong core reading instruction for all students Enough time spent to meet the needs of many students who do not typically receive powerful support at home Enough quality so that the increased instructional time is spent effectively Time X quality = yearly growth
Whether or not we achieve these goals depends on the strength of our instruction to do two things during the year Insuring students who are behind make expected yearly growth plus catch-up growth Effective differentiated instruction by classroom teacher Effective school-level systems and resources to provide additional intensive intervention in small enough groups for enough time, and with enough skill Time X quality = yearly growth + catch-up growth
From the “science of reading” From effective schools Information about the individual components of instruction and assessment that are most effective in raising literacy levels Information about leadership, organizational, and classroom practices that are most effective in raising literacy levels In order to effectively prevent early reading difficulties, we need to apply two kinds of knowledge Understanding, and Motivation to Apply
Lessons learned from the Kennewick, Washington school district: Located in southeastern Washington Has about 15,000 students – 13 elementary schools, four middle schools, and 3 high schools 25% of students are ethnic minorities, and 48% elementary school students qualify for free or reduced price lunch
Lessons learned from the Kennewick, Washington school district: In 1995, the school board in Kennewick challenged the elementary schools to have 90% of their students at grade level in reading by the end of third grade –within 3 years The primary responsibility for accomplishing this was assigned to the school principals
Lessons learned from the Kennewick, Washington school district: From David Montague, a principal: “We thought the board and the superintendent were crazy…I saw in the White Paper that elementary principals were responsible, and said ‘Why don’t they come down to our building and see the kids that come to our school?’ I mean, our kindergarten kids seem to enter school every year with lower skills…”
Lessons learned from the Kennewick, Washington school district: From David Montague, a principal: “After that, the whining died down. The goal started to grow legs….Principals are messengers. When you’re in the message business, it doesn’t help to criticize the message. It drives a wedge. It empowers those who don’t want to change. Since we’re responsible for implementation, it makes no sense to send a mixed message. Principals cannot play ‘loyal opposition’ harping against accountability and at the same time provide effective leadership for growth”
Lessons learned from the Kennewick, Washington school district: The District passed a bond that provided a district reading teacher for each school, and began to hold public meetings at a different elementary school every two weeks. At the schools… “We began to have serious staff meetings…we began going through the district White Paper and looking at the test data to see how far behind some of our kids were. It was the first time Washington had ever had such precise data. In the fall of 995, 23% of our 3rd graders were reading at second grade level and 41% of our 3rd graders were reading at a kindergarten or 1st grade level.
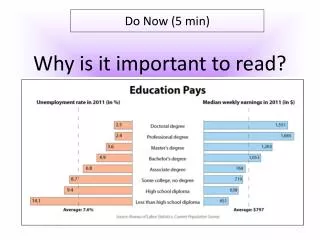
“In the United States, public schools deliver 85% or more of their curriculum by reading textbooks, whiteboards, worksheets, and computer screens. Students must read well to do well. It matters little what else they learn in elementary school if they do not learn to read at grade level. Even math depends on reading. There are far more words than numbers in math books. As the math concepts become more complicated, the verbal descriptions become more involved as well. As Kennewick has focused on reading, our math scores have improved at a rate similar to our reading scores. The reading problem becomes more obvious in middle school where students who cannot read well struggle to absorb content in all other subjects.” P. 49 Fielding, L., Kerr, N., & Rosier, P. (2007). Annual growth for all students, catch-up growth for those who are behind. Kennewick, WA: The New Foundation Press, Inc.
Working harder and more effectively at 3rd grade Baseline year Washington Elementary School Growth in % of 3rd grade students meeting grade level standards School Year 95 96 97 98 99 00 01 02 03 04 05 06 Percent at Grade level 57 72 72 68 78 94 96 99 94 98 99 98
From the Principal: “By the 3rd year, we had exhausted our work-harder-at-third-grade strategy…More of the catch-up gain had to be made at second and first grade. Our first-and second-grade teachers realized that they had to become more accountable for their students’ learning. Even our kindergarten teachers, who had spent most of their class time on social activities, began the transition to teaching phonemic awareness along with letter and sound recognition.”
Began providing intensive interventions in the afternoon to many students Working harder and more effectively at 3rd grade Result of improvement at both 2nd and 3rd Grade Baseline year Began testing in 2nd grade and focusing on earlier improvement Washington Elementary School Growth in % of 3rd grade students meeting grade level standards School Year 95 96 97 98 99 00 01 02 03 04 05 06 Percent at Grade level 57 72 72 68 78 94 96 99 94 98 99 98
Washington Elementary School School Characteristics 55% Free/reduced lunch 28% Minority 85% Stability Teaching Staff 2 half-day kindergarten teachers 3 classroom teachers each in 1-5 1 District Reading Specialist 3 Title I Teachers 1.5 Resource room/special ed teachers 1 PE teacher 1 librarian, 1 Librarian secretary 3 Specials teachers 9 paraprofessionals
Washington Elementary School How they get additional instructional power in first grade During the Morning Reading Block Small group reading during 1st hour of the day It puts 13 adults with 75 students during the first hour in first grade Struggling students get 1:3 with most skilled instructor Advanced students get 1:7 ratios with paras and others In the afternoon Many students get additional small group or 1:1 instruction time as interventions
Washington Elementary School The reading block for 3 first grade classrooms 1st hour (8:45-9:45) Small group instruction 3 classroom teachers 1 District Reading Teacher 2 Title I teachers Specials teacher PE teacher 6 paraprofessionals 2nd hour (9:45-10:45) Whole group instruction 2nd hour (9:45-10:45) Also, during the second hour, paras, Title 1, and others work in small groups with 2nd-5th grades In the afternoon, many students are provided an additional 40-90 minutes of intervention
From David Motague ”By the fifth year, I was convinced high performance reading was about more time and better use of that time. Students who were behind needed more direct instruction. Some of them started getting 60 to 90 minutes extra each day for a total of 180 to 210 minutes a day. We spent that time on the sub-skills they hadn’t mastered.” “For most of Kennewick’s high performance elementary schools, increasing the amount of time spent on direct reading instruction was an intuitive decision. They tried more time. It worked, and they kept on doing it. It was merely an extension of what remediation was about. Principals and many teachers at these schools saw the direct connection between increasing instructional time and increasing reading growth. Students who were a little behind needed a little more instructional time. Students who were a lot behind needed a lot more time.” P. 38.
“Growth is directly proportionate to the quality and quantity of instructional time. When we looked at our data student by student, we saw a painful fact with painful clarity. Most students who start behind stay behind. Time-starved reading programs that rely on sudden growth bursts from extraordinary instruction rarely move students from the 5th-30th percentiles up to grade level.” P. 48 “Catch-up growth is driven primarily by proportional increases in direct instructional time. Catch-up growth is so difficult to achieve that it can be the product only of quality instruction in great quantity.”
Teacher quality x time = growth “Quantity of instructional time can be doubled or tripled in a semester. Quality of instructional time cannot. Improving quality occurs over extended periods of time, at different rates for different teachers in the same school, as a constant process of arduous, intelligent labor. Teacher quality (1) x time (1) = growth (1) Teacher quality (1) x time (2) = growth (2) Teacher quality (1) x time (3) = growth (3)
Teacher quality x time = growth “This is why the primary and immediate strategy for catch-up growth is proportional increase in direct instructional time. Catch-up growth rarely occurs unless principals and teachers have good data, know each student’s learning needs, and schedule proportional increases in direct instructional time.”
3rd Grade Interventions 2nd Grade Interventions % at Grade Level, 2003 1st Grade Reading Block 3rd Grade Reading Block 1st Grade Interventions 2nd Grade Reading Block % FR Lunch
Two indices from progress monitoring measures that provide data about effectiveness of core instruction and interventions Effectiveness of Core Instruction (ECI) measures the percentage of students who began the school year (Assessment 1) on grade level (in green zone) and remained on grade level in the assessment period being reported (middle or end of year) –make expected yearly gain
The ECI in one classroom screening outcome 1 2 3 4 5 6 7 8 9 10 11 12 1314 15 16 17 19 20 21 1 23456 7 8 91011 12 1314 15 1617 19 2021 9 of 13 students who were at grade level continue at grade level One academic year ECI = .69
ECI Green Students STAY Green Students From Assessment 1 to Assessment 2 Assessment 1 to Assessment 3
Two indices from progress monitoring measures that provide data about effectiveness of core instruction and interventions Effectiveness of Interventions (EI) shows the percentage of students who began the year at some level of risk for reading difficulties (reading below grade level) but who grew rapidly enough to advance to a lower level of risk, or to grade level, by the end of the year.
The EI in one classroom screening outcome 1 2 3 4 5 6 7 8 9 10 11 12 1314 15 16 17 19 20 21 1 23456 7 8 91011 12 1314 1516 17 19 2021 3 of 7 students who were at “at risk” moved to a lower risk level One academic year EI = .43
EI RedorYellowStudents IMPROVE TO Yellow orGreen Students From Assessment 1 to Assessment 2 Assessment 1 to Assessment 3
The EI index can be broken into two more specific indicators EI-I shows the percentage of students who began the year at the “intensive” or highest level of risk (red) but who grew rapidly enough to advance to strategic (yellow) or grade level (green) by the end of the year. EI-S shows the percentage of students who began the year at the “strategic” or moderate level of risk (yellow) but who grew rapidly enough to advance to grade level (green) by the end of the year.
The EI in one classroom screening outcome 1 2 3 4 5 6 7 8 9 10 11 12 1314 15 16 17 19 20 21 1 23456 7 8 91011 12 1314 1516 17 19 2021 1 of 3 students who were at “high risk” moved to a lower risk level One academic year EI-I = .33 2 of 4 students who were at “moderate” risk moved to grade level EI-I = .50
EI-I RedStudents IMPROVE TO Yellow orGreen Students From Assessment 1 to Assessment 2 Assessment 1 to Assessment 3
EI-S YellowStudents IMPROVE TO Green Students From Assessment 1 to Assessment 2 Assessment 1 to Assessment 3
What They Are ECI and EI are two measures, based on the Recommended Instructional Level (RIL) for students, that can be used to monitor the performance of the core reading program and the intensive intervention program(s) in schools. Splits the reading program into two separate parts—core instruction and interventions- more analytic
What They Are Not ECI and EI should not be considered as the primary measure in evaluating schoolwide performance in reading. These are formative assessment- meant to help focus professional development, resources, school level planning. They are not the same as outcome measures.
Cautions • Population Sensitive • Based on students that remain in the same school for each assessment • Small populations have volatile measures • Can lose all students=have no measure • Kindergarten and 1st grade Assessment 1 measures are different than assessment 3 • Data requirements • Must have within year, longitudinally identifiable data
Cautions • What should we expect? • With a new measure, we often don’t know what to expect, or what is “good performance” Goal for ECI should be 100% Goal for EI should be around 50%
Looking at trends in outcome data over time as a way of thinking about needed changes or improvements
Using School, or District, or State Level Reading outcome data to make decisions about allocation of resources and activities to improve school performance Two kinds of analysis 1.Examining trends across measures for purposes of planning professional development, support and guidance 2.Examining differences in performance across schools for purposes of planning and implementing differentiated support and oversight
Using School, or District, or State Level Reading outcome data to make decisions about allocation of resources and activities to improve school performance Two kinds of analysis 1.Examining trends across measures for purposes of planning professional development, support and guidance 2.Examining differences in performance across schools for purposes of planning and implementing differentiated support and oversight
Year to Year changes in performance on a combined measure of PA, Letter knowledge, and decoding Kindergarten End of year Year to Year changes in measure of oral vocabulary
50 48 44 43 43 41 38 38 Year to Year improvement in % of students at “grade level” in oral vocabulary in grades Kindergarten through Third
Other patterns that might be observed, and that would have clear implications for focus and professional development 1st Grade growth in decoding >> growth in Fluency 2nd Grade growth in fluency >> growth in Reading Comprehension 3rd grade -- 60% of students are at grade level in reading fluency, but only 45% are at grade level in reading comprehension
Year to Year changes in performance on the PSF, NWF, and ORF tests on DIBELS at the end of First Grade Are they really doing that much better in phonemic awareness and phonemic decoding than in reading fluency?
When comparing performance across measures, it is very important to know that you are using equivalent standards for “grade level” performance on each measure - setting bar at the same height Percentile ranks derived from DIBELS norms for end of year targets in PSF, NWF, and ORF at end of first grade Good, et al., (2002). System-wide Percentile Ranks for DIBELS Benchmark Assessment (Tech. Report 9). University of Oregon. PSF = 13th percentile NWF = 29th percentile ORF = 35th percentile
1.Examining state level trends across measures for purposes of planning state wide professional development and support Looking at year to year improvements on different measures as well as relative levels of performance on different measures Examining performance on different measures across grade levels If progress monitoring measures are available, examining growth within a year at different grade levels – looking for grade level weaknesses
Rcomp = SAT10 ORF = Dibels Voc = PPVT Percent of Students at “grade level” in Reading Comprehension, Oral Reading Fluency, and Oral Vocabulary in grades 1-3, 584 schools from 3 cohorts—1st through 3rd year schools
Rcomp = SAT10 ORF = Dibels Voc = PPVT Percent of Students at “grade level” in Reading Comprehension, Oral Reading Fluency, and Oral Vocabulary in grades 1-3 – 318 schools after three years
There are two possible measurement problems associated with this comparison The DIBELS end of year targets, because of the way they were developed, correspond to different percentile ranks across grades 1st grade = 35th percentile 2nd grade = 39th percentile 3rd grade = 40thth percentile