Download
1 / 31
360 likes | 1.27k Vues
Mass Spectrometry and Proteomics. Paolo Lecchi, PhD Dept. of Pharmacology George Washington University. October 13, 2003. MS. WHAT IS A “MASS SPECTROMETER ”...?. CRIMS. MALDI. LC/MS. QTOF. quad. APC I. FAB. TOF. ESI. ESI. ESI. E I. ES I. FT-ICR. LC-MSMS. qQTOF. Ion trap.

E N D
Mass Spectrometry and Proteomics Paolo Lecchi, PhD Dept. of Pharmacology George Washington University October 13, 2003
MS WHAT IS A “MASS SPECTROMETER ”...?
CRIMS MALDI LC/MS QTOF quad. APCI FAB TOF ESI ESI ESI EI ESI FT-ICR LC-MSMS qQTOF Ion trap SELDI …many black boxes ! The black box problem…...
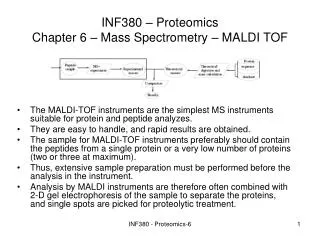
“A MASS SPECTROMETER MEASURES THE MW….” “...A MS ANALYSIS GIVES THE MASS-TO-CHARGE RATIO (m/z) OF IONS…IN GAS PHASE”.
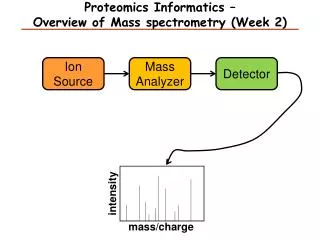
Pumping system vacuum ION SOURCE ANALYZER ion separation Sample introduction TOF, quadrupole, ION TRAP DIRECT INTRODUCTION (solid, liquid, gas) SEPARATION TECHNIQUE (HPLC, CE, GC) Detector Data Processing MALDI, FAB, EI, ELECTROSPRAY
+ + + + + + + + + + + + + + + + + + + + + + + + + + + + + + + + + + + + + + + + + + + + + + + + + + + + + + + + + + + + + + + + + + + + + + + + + + + + + + + + + + + + + + + + + + + + + + + + + + + + + + + + + + + + + + + + + + + + + + + + + + + + + + + + + + + + + + + + + + + + + + + + + + + + + + + + + + + + + + + + + + + + + + + 3 nS LASER PULSE MALDI TOF analyzer Sample (solid) on target at high voltage/ high vacuum High vacuum MALDI is a solid-state technique that gives ions in pulses, best suited to time-of-flight MS. ESI Liquid flow Q or Ion Trap analyzer Atmosphere Low vac. High vac. ESI is a solution technique that gives a continuous stream of ions, best for quadrupoles, ion traps, etc.
….MALDI or Electrospray ? MALDI is limited to solid state, ESI to liquid ESI is better for the analysis of complex mixture as it is directly interfaced to a separation techniques (i.e. HPLC or CE) MALDI is more “flexible” (MW from 200 to 400,000 Da) Until recently only ESI was available for high quality tandem-MS MALDI is easier to use and maintain
MALDI-TOF spectra of apomyoglobin Sample: 1 pmole apomyoglobin (horse skeletal muscle) INSTRUMENT: Kratos Axima-CFR
+15 +17 +18 +16 100 998.1 1131.0 942.8 1060.4 +14 +19 80 893.2 1211.7 +20 +13 848.6 1304.8 60 +21 Relative Abundance 808.2 +12 +22 16951.5 40 1413.5 +11 771.5 +23 100 1541.8 +9 +10 738.0 +24 20 1695.9 1884.5 707.4 +25 80 679.1 +9 60 1884.3 Relative Abundance AFTER DECONVOLUTION 0 400 500 600 700 800 900 1000 1100 1200 1300 1400 1500 1600 1700 1800 1900 2000 40 m/z 20 Sample: 1 pmole apomyoglobin (horse skeletal muscle) 0 16000 16400 16800 17200 17600 18000 18400 mass INSTRUMENT: Thermoquest LCQ-classic ESI-ion trap spectra of apomyoglobin ACTUAL SPECTRUM
? ? ? ? A “RESEARCH GRADE” MS (200 to 500 k$) PROVIDES AN ACCURATE MW DETERMINATION:~ 10 ppm (e.g. 1000.0 ± 0.1)
...don’t forget the “S factors” ACCURACY IS NOT THE ONLY PARAMETER TO BE CONSIDERED IN A MASS SPECTROMETER...
MALDI ESI Sensitivity =femtomole 10-15 M (...attomole 10-18 M) Simplicity= very easy training required $$$= 70 to 650 k$ 120 to 650 k$ Speed (high throughput)= ~104/day dynamic system Selectivity(resolution) = >5000 Structural information = MS/MS MSn Software= “ ...evaluation in progress.”
resolution: ~20,000 0.1 amu MALDI analysis of a peptide m/z 2098 (6 fmoles loaded) Data: NDR_thin_2Ghz_blk_6fload0001.G24 20 May 2002 16:49 Cal: Kent_SP2_blk_1567 20 May 2002 14:31 Kratos PC Axima CFR V2.3.0a: Mode reflectron_2GHz, Power: 48, Blanked, P.Ext. @ 2095 (bin 135) %Int. 2099.17 100 90 2098.18 Expected peptide mass 2098.20 (0.02 amu difference) Accuracy: (~10 ppm) 80 70 60 2100.18 50 40 30 2101.19 20 10 0 2092 2094 2096 2098 2100 2102 2104 2106 2108 Mass/Charge
Pusher electrode with pulsed VAcc Needle@4kV ions Liquid To reflectron TOF NEW INSTRUMENT DESIGNS MAKE ESI AND MALDI MORE “INTERCHANGEABLE”... Orthogonal acceleration-TOF is compatible with a continuous ion current, such as from ESI.
Schematic of QSTAR (with MALDI source) UV laser pulses via attenuator, fiber optic cable and lens to vacuum system Ar collision gas N2 Laser Pusher Puller MCP 1x10⁻² Torr 2x10⁻⁵ Torr Thermal equilib. MS1 mass selection Hinged door CID q0 Q1 q2 96-well MALDI target 5x10⁻⁷ Torr MS2 mass selection Liner Ion mirror MALDI can be carried out at “high” pressure. Ions collide with gas molecules, are slowed down and thermally equilibrated. Pulses are “smeared out” to give a semi-continuous ion current.
Nobel Prize in Chemistry 2002 “...for their developments of soft desorption ionisation methods for mass spectrometric analysis of biological macromolecules”. 1/4 to John B. Fenn (USA) Virginia Commonwealth University 1/4 to Koichi Tanaka (Japan) Shimadzu. Corp. Kyoto Electrospray Laser Ionization 1//2 of the prize went to Kurt Wutrich (Switzerland) development of NMR analysis
“..other than biochemistry done very, very fast, is not entirely clear to me what proteomics is.” Marvin Cassman, Director of the National Institute of General Medical Sciences * C&E News, March 18, 2002 (*) ~90% of the NIH-funded mass spectrometry lab receive grants from NIGMS.
THE ROLE OF MASS SPECTROMETRY IN PROTEOMICS: IDENTIFICATION OF PROTEINS, USUALLY IN COMPLEX MIXTURES ANALYSIS OF POSTRANSLATIONAL AND CHEMICAL MODIFICATIONS DIFFERENTIAL EXPRESSION AND QUANTITATION
1000 1500 2000 Mass (m/z) Extract peptides; mass analyze Run 2Dgel; stain; scan Excise spot; elute; digest Protein identification 2D-PAGE AND MASS PECTROMETRY...…A PARADIGM IN PROTEOMICS
EXPERIMENTAL PROCEDURES IN PROTEOMICS • SEPARATIONelectrophoresis (1-D, 2-D) chromatography (SEC, ion exchange, reversed phase) • DIGESTIONchemical (BrCN) enzymatic (trypsin,, Lys-C, Asp-C) • reduction(Di-Thio-Threitol, b-Mercapto-Ethanol) • alkylation(IodoAcAcid, IodoAcAmide, Vynil Pyridine) • SAMPLE CLEAN UPchromatography(reversed phase) solid phase extraction(Zip Tip) • MALDI MS ANALYSIS • protein identification (peptide mass fingerprinting) • peptide structural information (post source decay)
2-D PAGE AND MASS SPECTROMETRY... ...NOT THE IDEAL TECHNIQUE FOR PROTEOMICS: Mass spectrometry improved substantially during the last 10 years... 2D-PAGE still is the most powerful separation technique but has several disadvantages...
DISADVANTAGES OF 2-D PAGE... Restricted to proteins < 106 and > 104 Da MW Cannot detect proteins expressed at low levels Limited to 600~800 separate spots Gel to gel reproducibility is poor Quantitation is poor, ± 50% or worse Dynamic range is limited, < 10X Analysis is not directly coupled to separation
MS SECOND DIMENSION: e.g. Reversed Phase Ion-Exchange FIRST DIMENSION: e.g. Size Exclusion, Ion-Exchange MULTI-DIMENSIONAL SEPARATIONS: AN ALTERNATIVE TO 2-D PAGE In multidimensional chromatography two (or more) techniques with “orthogonal” properties are combined to achieve higher separation power.
HYBRID 2-D SEPARATION: IEF-HPLC Sample: E. coli extract First dimension: y-axes IEF (Biorad rotofor) Second dimension: x-axes IEF fractions separated by HPLC (reversed phase C-18) Lecchi et. al. JBBM june 2003
…to improve the efficiency of the proteolytic digestion it is important to reduce and alkylate disulfide bonds s s s s R R s R s s s R alkylation reduction s s s R R s s R s R s s enzymatic digestion
H H R-CN-R’ peptide bond protein O O Proteolytic* enzyme H2O N-R’ R-C-OH + (proteolytic fragments) H Enzymatic digestion *Some proteolytic enzymes are very specific, e.g.: trypsin cuts only at Lys-X or Arg-X Lys-C Lys-X Arg-C Arg-X Glu-C (V-8) Glu-X and Asp-X
Peptide Mass Fingerprinting (PMF) MS analysis of proteolytic fragments is a common way to identify a protein. The following masses are entered in a database for protein identification: 737.99 - 874.44 - 936.48 - 1030.65 - 1047.06 - 1153.67 - 1269.76 - 1428.85 1536.76 - 1676.97 - 1808.06 - 1862.99 - 2163.26 - 2274.28 Low MW peaks (e.g. < 500 Da) are not generally used because of the high interference of the matrix.
PROTEINS 200,000 GENES 35,000 TRYPTIC PEPTIDES 4,000,000 “IS NOT JUST ABOUT ‘SEPARATION POWER” THERE IS A HUGE DYNAMIC RANGE OF PROTEIN EXPRESSION (12 orders of magnitude) AN IDEAL METHOD SHOULD BE ABLE TO IDENTIFY AND QUANTIFY PROTEINS WHOSE EXPRESSION LEVELS CHANGE 1 peptide/sec = ~46 days
“Proteomics is knowing the structure and function of all proteins from all organisms…that is not possible. We need to be more selective”. George Kenyon, University of Michigan. In his opening remark at the meeting: “Defining the Mandate of Proteomics in the Post-Genomic Era”. National Academies, Washington DC, March 2002.