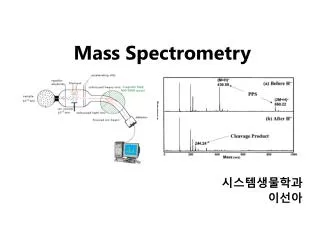
Proteomics & Mass Spectrometry
Proteomics & Mass Spectrometry. Nathan Edwards Center for Bioinformatics and Computational Biology. Outline. Proteomics Mass Spectrometry Protein Identification Peptide Mass Fingerprint Tandem Mass Spectrometry. Proteomics. Proteins are the machines that drive much of biology


Proteomics & Mass Spectrometry
E N D
Presentation Transcript
Proteomics & Mass Spectrometry Nathan Edwards Center for Bioinformatics and Computational Biology
Outline • Proteomics • Mass Spectrometry • Protein Identification • Peptide Mass Fingerprint • Tandem Mass Spectrometry
Proteomics • Proteins are the machines that drive much of biology • Genes are merely the recipe • The direct characterization of a sample’s proteins en masse. • What proteins are present? • How much of each protein is present?
Systems Biology • Establish relationships by • Choosing related samples, • Global characterization, and • Comparison.
Samples • Healthy / Diseased • Cancerous / Benign • Drug resistant / Drug susceptible • Bound / Unbound • Tissue specific • Cellular location specific • Mitochondria, Membrane
Protein separation Molecular weight (MW) Isoelectric point (pI) Staining Birds-eye view of protein abundance 2D Gel-Electrophoresis
2D Gel-Electrophoresis Bécamel et al., Biol. Proced. Online 2002;4:94-104.
Paradigm Shift • Traditional protein chemistry assay methods struggle to establish identity. • Identity requires: • Specificity of measurement (Precision) • Mass spectrometry • A reference for comparison (Measurement → Identity) • Protein sequence databases
Sample + _ Detector Ionizer Mass Analyzer Mass Spectrometer ElectronMultiplier(EM) Time-Of-Flight (TOF) Quadrapole Ion-Trap MALDI Electro-SprayIonization (ESI)
Mass Spectrometer (MALDI-TOF) UV (337 nm) Microchannel plate detector Field-free drift zone Source Pulse voltage Analyte/matrix Ed = 0 Length = D Length = s Backing plate (grounded) Extraction grid (source voltage -Vs) Detector grid -Vs
Peptide Mass Fingerprint Cut out 2D-GelSpot
Peptide Mass Fingerprint Trypsin Digest
Peptide Mass Fingerprint • Trypsin: digestion enzyme • Highly specific • Cuts after K & R except if followed by P • Protein sequence from sequence database • In silico digest • Mass computation • For each protein sequence in turn: • Compare computer generated masses with observed spectrum
Protein Sequence • Myoglobin - Plains zebraGLSDGEWQQV LNVWGKVEAD IAGHGQEVLI RLFTGHPETL EKFDKFKHLK TEAEMKASED LKKHGTVVLT ALGGILKKKG HHEAELKPLA QSHATKHKIP IKYLEFISDA IIHVLHSKHP GDFGADAQGA MTKALELFRN DIAAKYKELG FQG
Protein Sequence • Myoglobin - Plains zebraGLSDGEWQQV LNVWGKVEAD IAGHGQEVLI RLFTGHPETL EKFDKFKHLK TEAEMKASED LKKHGTVVLT ALGGILKKKG HHEAELKPLA QSHATKHKIP IKYLEFISDA IIHVLHSKHP GDFGADAQGA MTKALELFRN DIAAKYKELG FQG
Peptide Masses 1811.90 GLSDGEWQQVLNVWGK 1606.85 VEADIAGHGQEVLIR 1271.66 LFTGHPETLEK 1378.83 HGTVVLTALGGILK 1982.05 KGHHEAELKPLAQSHATK 1853.95 GHHEAELKPLAQSHATK 1884.01 YLEFISDAIIHVLHSK 1502.66 HPGDFGADAQGAMTK 748.43 ALELFR
Peptide Mass Fingerprint YLEFISDAIIHVLHSK GHHEAELKPLAQSHATK GLSDGEWQQVLNVWGK HPGDFGADAQGAMTK HGTVVLTALGGILK VEADIAGHGQEVLIR KGHHEAELKPLAQSHATK ALELFR LFTGHPETLEK
Mass Spectrometry • Strengths • Precise molecular weight • Fragmentation • Automated • Weaknesses • Best for a few molecules at a time • Best for small molecules • Mass-to-charge ratio, not mass • Intensity ≠ Abundance
Enzymatic Digest and Fractionation Sample Preparation for MS/MS
Tandem Mass Spectrometry(MS/MS) Precursor selection
Tandem Mass Spectrometry(MS/MS) Precursor selection + collision induced dissociation (CID) MS/MS
Peptide Fragmentation Peptides consist of amino-acids arranged in a linear backbone. N-terminus H…-HN-CH-CO-NH-CH-CO-NH-CH-CO-…OH Ri-1 Ri Ri+1 C-terminus AA residuei-1 AA residuei AA residuei+1
yn-i bi Peptide Fragmentation yn-i-1 -HN-CH-CO-NH-CH-CO-NH- CH-R’ Ri i+1 R” i+1 bi+1
Peptide Fragmentation Peptide: S-G-F-L-E-E-D-E-L-K
Peptide Fragmentation 88 145 292 405 534 663 778 907 1020 1166 b ions S G F L E E D E L K 1166 1080 1022 875 762 633 504 389 260 147 y ions 100 % Intensity 0 m/z 250 500 750 1000
Peptide Fragmentation 88 145 292 405 534 663 778 907 1020 1166 b ions S G F L E E D E L K 1166 1080 1022 875 762 633 504 389 260 147 y ions y6 100 y7 % Intensity y5 b3 b4 y2 y3 b5 y8 y4 b8 y9 b6 b7 b9 0 m/z 250 500 750 1000
Peptide Identification Given: • The mass of the precursor ion, and • The MS/MS spectrum Output: • The amino-acid sequence of the peptide
Peptide Identification Two paradigms: • De novo interpretation • Sequence database search
100 % Intensity 0 m/z 250 500 750 1000 De Novo Interpretation
100 % Intensity E L 0 m/z 250 500 750 1000 De Novo Interpretation
100 % Intensity SGF G E E E D E KL E E D L L L F 0 m/z 250 500 750 1000 De Novo Interpretation
De Novo Interpretation …from Lu and Chen (2003), JCB 10:1
De Novo Interpretation …from Lu and Chen (2003), JCB 10:1
De Novo Interpretation • Find good paths in spectrum graph • Can’t use same peak twice • Simple peptide fragmentation model • Usually many apparently good solutions • Amino-acids have duplicate masses! • “Best” de novo interpretation may have no biological relevance • Identifies relatively few peptides in high-throughput workflows
Sequence Database Search • Compares peptides from a protein sequence database with spectra • Filter peptide candidates by • Precursor mass • Digest motif • Score each peptide against spectrum • Generate all possible peptide fragments • Match putative fragments with peaks • Score and rank
Peptide Fragmentation S G F L E E D E L K 100 % Intensity 0 m/z 250 500 750 1000
Peptide Fragmentation 88 145 292 405 534 663 778 907 1020 1166 b ions S G F L E E D E L K 1166 1080 1022 875 762 633 504 389 260 147 y ions 100 % Intensity 0 m/z 250 500 750 1000
Peptide Fragmentation 88 145 292 405 534 663 778 907 1020 1166 b ions S G F L E E D E L K 1166 1080 1022 875 762 633 504 389 260 147 y ions y6 100 y7 % Intensity y5 b3 b4 y2 y3 b5 y8 y4 b8 y9 b6 b7 b9 0 m/z 250 500 750 1000
Sequence Database Search • Sequence fills in gaps in the spectrum • All candidates have biological relevance • Practical for high-throughput peptide identification • Correct peptide might be missing from database!
Peptide Candidate Filtering Digestion Enzyme: Trypsin • Cuts just after K or R unless followed by a P. • Must allow for “missed” cleavage sites • “Average” peptide length about 10-15 amino-acids
Peptide Candidate Filtering >ALBU_HUMAN MKWVTFISLLFLFSSAYSRGVFRRDAHKSEVAHRFKDLGEENFKALVLIAFAQYLQQCPFEDHVKLVNEVTEFAK… No missed cleavage sites MK WVTFISLLFLFSSAYSR GVFR R DAHK SEVAHR FK DLGEENFK ALVLIAFAQYLQQCPFEDHVK LVNEVTEFAK …
Peptide Candidate Filtering >ALBU_HUMAN MKWVTFISLLFLFSSAYSRGVFRRDAHKSEVAHRFKDLGEENFKALVLIAFAQYLQQCPFEDHVKLVNEVTEFAK… One missed cleavage site MKWVTFISLLFLFSSAYSR WVTFISLLFLFSSAYSRGVFR GVFRR RDAHK DAHKSEVAHR SEVAHRFK FKDLGEENFK DLGEENFKALVLIAFAQYLQQCPFEDHVK ALVLIAFAQYLQQCPFEDHVKLVNEVTEFAK …