Download

1 / 16
160 likes | 182 Vues
Explore the application of crosstabs and Chi-Square tests in psychology when analyzing categorical variables. Learn the process from setting hypotheses to computing expected frequencies and making decisions using SPSS. Discover the power of these methods and when to use them effectively.

E N D
Crosstabs and Chi Squares Computer Applications inPsychology
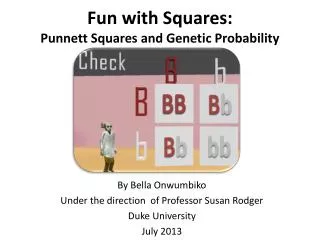
When do we use these methods? • When we have categorical variables • Do the percentages match up with how we thought they would? • Are two (or more) categorical variables independent? • Can do it with continuous variables • If you convert them into categories • Typically don’t want to do this because you lose a lot of information, and these tests are not as “powerful” as parametric tests
Example A manufacturer of watches takes a sample of 200 people. Each person is classified by age and watch type preference (digital vs. analog). The question: is there a relationship between age and watch preference?
Chi-Squared Test for Independence • Step 1: State the hypotheses and select an alpha level • H0: Preference is independent of age • H1: Preference is related to age • We’ll set a = 0.05
Chi-Squared Test for Independence • Step 2: • Compute your degrees of freedom df = (#Columns - 1) * (#Rows - 1) • Go to Chi-square statistic table and find the critical value • For this example, with df = 2, and a = 0.05 the critical chi-squared value is 5.99
Chi-Squared Test for Independence • Step 3: Obtain row and column totals (sometimes called the marginals) and calculate the expected frequencies
For people under 30 For people over 30 Computing Expected Frequencies For digital For analog For undecided
Computing the Chi-square 2 • Find the residuals (fo - fe) for each cell • Square these differences • Divide the squared differences by fe • Sum the results
Computing the Chi-Square And finally
Chi-Squared, the final step • Step 4: Compare this computed statistic (38.09) against the critical value (5.99) and make a decision about your hypotheses • here we reject the H0 and conclude that there is a relationship between age and watch preference
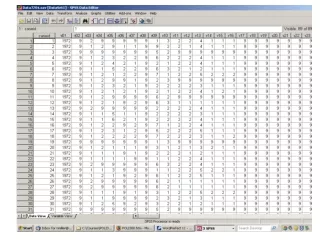
SPSS • Okay, now let’s see how to do this in SPSS