Download
1 / 7
80 likes | 212 Vues
Crosstabs and significance. Standard Errors of correlations. Personal Income. Estimated | 1999 | Personal | Income | Freq. Percent Cum. ------------+----------------------------------- 1 | 178 11.16 11.16

E N D
Crosstabs and significance Standard Errors of correlations
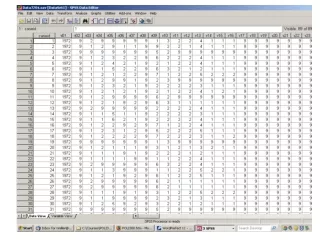
Personal Income Estimated | 1999 | Personal | Income | Freq. Percent Cum. ------------+----------------------------------- 1 | 178 11.16 11.16 2 | 156 9.78 20.94 3 | 170 10.66 31.60 4 | 249 15.61 47.21 5 | 275 17.24 64.45 6 | 240 15.05 79.50 7 | 130 8.15 87.65 8 | 56 3.51 91.16 9 | 41 2.57 93.73 10 | 26 1.63 95.36 11 | 22 1.38 96.74 12 | 6 0.38 97.12 13 | 11 0.69 97.81 14 | 5 0.31 98.12 15 | 4 0.25 98.37 16 | 6 0.38 98.75 17 | 6 0.38 99.12 19 | 2 0.13 99.25 21 | 2 0.13 99.37 22 | 10 0.63 100.00 ------------+----------------------------------- Total | 1,595 100.00
Years of Education Years of | Formal | Education | Freq. Percent Cum. ------------+----------------------------------- 0 | 3 0.17 0.17 2 | 3 0.17 0.33 4 | 5 0.28 0.61 5 | 2 0.11 0.72 6 | 14 0.78 1.50 7 | 12 0.67 2.17 8 | 30 1.67 3.84 9 | 26 1.45 5.28 10 | 52 2.89 8.18 11 | 66 3.67 11.85 12 | 483 26.86 38.71 13 | 181 10.07 48.78 14 | 240 13.35 62.12 15 | 106 5.90 68.02 16 | 316 17.58 85.60 17 | 259 14.40 100.00 ------------+----------------------------------- Total | 1,798 100.00
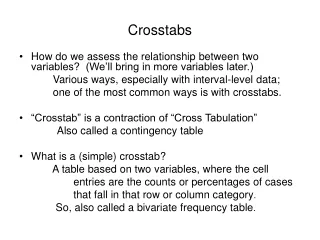
Crosstab | education income | 1 2 | Total -----------+----------------------+---------- 1 | 322 182 | 504 | 37.88 19.02 | 27.89 -----------+----------------------+---------- 2 | 362 402 | 764 | 42.59 42.01 | 42.28 -----------+----------------------+---------- 3 | 54 173 | 227 | 6.35 18.08 | 12.56 -----------+----------------------+---------- 4 | 112 200 | 312 | 13.18 20.90 | 17.27 -----------+----------------------+---------- Total | 850 957 | 1,807 | 100.00 100.00 | 100.00 Kendall's tau-b = 0.2214 ASE = 0.021
Bivariate Regression . regrPersonalIncome Education, b Source | SS df MS Number of obs = 1594 -------------+------------------------------ F( 1, 1592) = 263.57 Model | 2232.21442 1 2232.21442 Prob > F = 0.0000 Residual | 13483.1237 1592 8.46929882 R-squared = 0.1420 -------------+------------------------------ Adj R-squared = 0.1415 Total | 15715.3381 1593 9.86524679 Root MSE = 2.9102 ------------------------------------------------------------------------------ PersonalIn~e | Coef. Std. Err. t P>|t| Beta -------------+---------------------------------------------------------------- Education | .4600347 .0283365 16.23 0.000 .3768826 _cons | -1.317398 .3922899 -3.36 0.001 . ------------------------------------------------------------------------------
Bivariate Regression with Confidence Intervals . regrPersonalIncome Education Source | SS df MS Number of obs = 1594 -------------+------------------------------ F( 1, 1592) = 263.57 Model | 2232.21442 1 2232.21442 Prob > F = 0.0000 Residual | 13483.1237 1592 8.46929882 R-squared = 0.1420 -------------+------------------------------ Adj R-squared = 0.1415 Total | 15715.3381 1593 9.86524679 Root MSE = 2.9102 ------------------------------------------------------------------------------ PersonalIn~e | Coef. Std. Err. t P>|t| [95% Conf. Interval] -------------+---------------------------------------------------------------- Education | .4600347 .0283365 16.23 0.000 .4044539 .5156155 _cons | -1.317398 .3922899 -3.36 0.001 -2.086857 -.5479388 ------------------------------------------------------------------------------