Download
1 / 44
440 likes | 602 Vues
Strata Big Data Feb. 26, 2013 Let the Data Decide: Predictive Analytics in Healthcare Eugene Kolker eugene.kolker@seattlechildrens.org , gnklkr@yahoo.com. Outline. Appetizer: Introduction 2. Main Course: Prioritized Improvements (US News & World Report Metrics)

E N D
Strata Big DataFeb. 26, 2013 Let the Data Decide: Predictive Analytics in Healthcare Eugene Kolker eugene.kolker@seattlechildrens.org, gnklkr@yahoo.com
Outline Appetizer: Introduction 2. Main Course: Prioritized Improvements (US News & World Report Metrics) 3. Second Course: Personnel & Reduction of Waste (Nurses’ Turnover Trends) 4. Dessert: General Observations Thanks to Edd Dumbill, Alistair Croll, O’Reilly Media, the Organizers, & You!
1. Why Should You Care? Data Knowledge Action Our motto: Accelerating and optimizing your work through intuitive, reliable and powerful analytics Benefits
What is Seattle Children’s? Seattle Children’s: Hospital – Research – Foundation SCH: Non-profit, network, tertiary, 100 y.o. $0.8 Bln/yr, 5,000 FTEs, 350 beds (plans: 600) SCH covers 5 States (WWAMI region), 0-21 y.o. 6th on USNWR ranking of Ch. Hospitals 5th on Federal ranking of Ch. Research Institutes
Who is EK? Chief Data Officer @ SC Director, Bioinformatics & High-throughput Analysis Lab, SC Research Institute Affiliate Professor @ Depts of Biomedical Informatics & Medical Education and Pediatrics, University of Washington MS in Applied Mathematics & Computer Sciences, PhD in Structural Molecular Biology (Bioinformatics) + Business School Executive and Founding Editor of: “OMICS A Journal of Integrative Biology” and “Big Data”
Abstract In today’s data-driven age, healthcare is transitioning from opinion-based decisions to informed decisions based on data and analytics. Analyzing the data reveals trends and knowledge that may run contrary to our assumptions causing a shift in ultimate decisions that in turn will better serve both patients and healthcare enterprises.
WSJ Data news: Last weekend, Feb. 16-17 • Helmet laws • “helmet laws are associated with a 13% reduction in bicycle-related • head injuries, a 9% reduction in non-head bicycle-related injuries, and • an 11% increase in all types of injuries from the wheeled sports.“ • Buying habits • “conservatives like established national brands—and are significantly • less likely to try new items” • Sober vs. intoxicated eye witnesses • “Intoxicated eyewitnesses are no less reliable than sober ones, and • neither is very good at picking kidnappers out of a lineup”
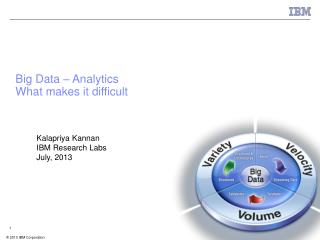
5 Vs of Big Data Volume, Veracity, Velocity, Variety, and Value Banking/Marketing/IT: Volume, Velocity, and Value Healthcare/Life Sciences: Veracity, Variety, and Value
Abstract, Cont. This talk illustrates our collaborative work with key stakeholders, including executive leadership, and describes a few representative, data-driven, and cost-effective projects.
2. Prioritized Improvements • US News & World Report • (USNWR) Metrics • Sponsors: • David Fisher, SVP, Medical Director and • Tom Hansen, CEO • Objective: • to prioritize enterprise-wide improvements based on USNWR Metrics (utilized as • Hospital & Departmental Metrics)
Prioritized Improvements, Cont. • Three key recommendations: • 1. Focus on care and outcomes for A1 and A2 • Departments (medical service lines) • A1 and A2 Department-specific Marketing • Implement 1-Day Immunization Reporting • This work is described in Kolker E. & Kolker E., • Chief Data Officer in Healthcare: Predictive Analytics Transforms Data to Knowledge to Action, • In: Chief Data Officer: Enterprise Data Solution for Business Challenges, MIT Press, 2013, in press. • Since 2007, SC moved from 11th to 6th rank
Model for C1 department • Reconstructed • model based on • provided data • Empirically • determined • transformation • applied to data
Prioritizing Improvements *First and **Second priority improvements
Guiding Improvements • Categories broken down for each department • Calculated as:maximum possible increase needed increase • Need total of 100 points in a column • to reach goal • Still, reputation has major influence in every department, however, there are numerous important factors to be improved
2. Implement 1-Day Immunization Reporting • All categories have both general & departmental measurements • 1. Advanced clinical services • - Services and programs organized around a particular • diagnosis, disease, need, or age group • 2. Overall infection prevention • - Hospital commitment to reducing infection risk • (tracking infections, immunization reporting, etc.) • 3. Commitment to best practices • - Includes participating in conferences, safety procedure • guidelines, database tracking, etc. • 4. Success in reducing ICU infections • - Rates of infection in ICUs
3. Personnel + Reduction of Waste • Nurses’ Turnover Trends • Sponsors: • Lisa Brandenburg, Hospital President and • Steven Hurwitz, VP, HR • ASK: something is happening with nurses WHAT?WHY? and HOW to deal with it?
Nurses’ Turnover Trends Findings: Termination rates higher after Magnet Status After Magnet Status more experienced nurses leaving more often 3. Overall termination decreases with experience, especially Involuntary termination
Nurses’ Turnover Trends, Cont. 4. Termination higher for VPs A & E, lower for others Higher termination for nurses living in Seattle No difference in termination for night versus day shifts
Methods For this initial look, we broke down nurses’ turnover into 3 categories: Active, Involuntary, and Voluntary terminations. We initially looked at differences in age, gender, years since hired, whether they had been rehired, department, ethnicity, and FTE. We have added comparisons on reporting VP, Seattle residency status, and shift. We also compared 2 time periods: Before and AfterMagnet Status
Methods, Cont. For all comparisons except time period, odds ratios (with 95% Confidence Interval) were calculated for each variable: Odds = P(termination)/P(active) Odds Ratio (OR)=odds(Male)/odds(Female), e.g. Hence, an OR = 1 implies no difference in termination rates, OR > 1, Males (or whatever category) has higher termination rate, OR < 1 lower termination rate Analyses were done unadjustedas well as with an adjustment for age and adjustments for age and experience (years since hire).
Conclusion 6: SHIFT (Night vs. Day) Termination looks higher on night shift, but the difference gone after adjusting for age and experience.
Conclusion 5: ZIP in Seattle (Seattle vs. Other areas) Termination higher for nurses living in Seattle.
Conclusion 4: VPs (vs. other VPs) Involuntary Termination A B C D E 10.0 5.0 2.0 1.0 0.5 0.2 0.1 Unadjusted Age Adj. Age and Exp. Adj. Involuntary termination higher for A and E. Note – OR = 1 for D (Unadj. and Age Adj.).
Conclusion 2: Before and After Magnet Status Experience of Terminated Nurses Experience of terminated nurses is higher After Magnet Status (Age Adj.). 29
3. Three Follow-up Actions • Discussions with (experienced) nurses • Bringing external consultant in-house • (psychology, sociology, nursing) • 3. Hiring re-adjustments
Bottom Line for 2. & 3. Do you want to: A: Improve the health of your patients B: Cut huge amounts of waste C: Increase your rankings? How about all three?
4. General Observations Working Together
EXA_3: Improve Care + Cost Savings • Summary: • Medically Complex Patients • (2+ Chronic Diseases), 80-20 rule • 2. Question: Number of Medications? Answer: 5+ • 3. Extremely complicated model with simple Q&A • Sponsor: Mark Del Beccarro, VP, Medical Affairs
EXA_4: Model of Seattle Downtown • Champions: Blake Nordstrom, Matt Griffin, • Jim Hendricks + DSA • An index of Downtown vitality which examines • four categories: Live, Work, Shop, andPlay • Enables comparison of Downtown across time • 2005 is baseline with score of 100
Dashboard: Integrated Score (Inflation Adj.) Play Work IS Shop 75% 100% Live
EXA_5: DELSA Global, delsaglobal.org Data-Enabled Life Sciences Alliance (DELSA Global) Data Knowledge Action Benefits
4. Bottom Line • “To call in the statistician after the experimentis done may be no more than asking him to perform a post-mortem examination: s/he may beable to say what the experiment died of.”Ronald Fisher, Cambridge U, 1938 • Our motto: Accelerating and optimizing your work through intuitive, reliable and powerful analytics Big data,Predictive analytics, Computational modeling: From Datathrough Knowledge & Action to Outcomes & Benefits
Thanks to Team: Roger HigdonNatali Kolker Bill Broomall Winn Haynes Chris Moss Beth Stewart Greg YandlImre JankoAndrew Lowe Larissa Stanberry Maggie Lackey Randy Salomon Chris Howard Skylar Johnson Nate Anderson Courtney MacNealy-Koch Gerald van Belle Vural Ozdemir Matthias Hebrok Corinna Gries Biaoyang Lin Todd Smith Geoffrey Fox Peter Arzberger Dan Atkins Deborah Elvins Rob Arnold Jack Faris Evelyne & Ben Kolker David Fisher, Lisa Branderburg, Kelly Wallace, Skip Smith, Wes Wright, Mark Del Beccarro, Sandy Meltzer, Steven Hurwitz, Bruder Stapleton, Peter Tarczy-Hornoch, Troy McGuire, Judy Dougherty, Lee Hunstman Jim HendricksTom Hansen Support: NSF, NIH, SCRI, Robert McMillen Foundation, Gordon and Betty Moore Foundation
Contact EK:gnklkr@yahoo.com or eugene.kolker@seattlechildrens.org For more info: kolkerlab.organd delsaglobal.org Thank You! Any questions?
Radom representation of data today: • REGULATION (WSJ Feb. 15, Week in Ideas: Daniel Akst) Helmet Headwind American kids need more exercise, but are helmet laws making them ride their bicycles less? Two economists say that could be the case. Helmet laws, they found, are associated not only with fewer bike-related head injuries for children but also with fewer non-head biking injuries. More than 20 states have laws requiring bike helmets, with various age limits, as do localities. "For 5-19 year olds," the researchers write, "we find the helmet laws are associated with a 13% reduction in bicycle head injuries, but the laws are also associated with a 9% reduction in non-head bicycle related injuries and an 11% increase in all types of injuries from the wheeled sports." The increase in injuries from other wheeled sports suggests young riders might be shifting to skateboards and roller skates instead of bicycling. "Effects of Bicycle Helmet Laws on Children's Injuries," Pinka Chatterji and Sara Markowitz, National Bureau of Economic Research Working Paper 18773 (February) American kids need more exercise, but are helmet laws making them ride their bicycles less?
Radom representation of data today: MARKETING (WSJ Feb. 15, Week in Ideas: Daniel Akst) Buying Conservatively Bringing a new product to market? You'll have a harder time in conservative parts of the country, a paper implies. A trio of business professors studied six years of supermarket purchases in counties covering nearly half the U.S. population and found that, when it comes to groceries, conservatives like established national brands—and are significantly less likely to try new items. "These tendencies," the researchers wrote, "correspond with other psychological traits associated with a conservative ideology, such as preference for tradition and the status quo, avoidance of ambiguity and uncertainty, and skepticism about new experiences." Conservative ideology was measured in the study by Republican voting behavior and religiosity. In counties high on both measures, generic products fared worse and new products had lower penetration. "Ideology and Brand Consumption," Romana Khan, Kanishka Misra and Vishal Singh, Psychological Science (Feb. 4)
Radom representation of data today: CRIMINAL JUSTICE (WSJ Feb. 15, Week in Ideas: Daniel Akst) Unreliable, Sober or Not Intoxicated eyewitnesses are no less reliable than sober ones—but neither is very good at picking culprits out of a lineup. Researchers in Sweden gave screwdrivers to two groups of presumably eager volunteers with the aim of a 0.04 blood alcohol concentration in one, and 0.07 in the other—both above the 0.02 Swedish limit for driving but below the 0.08 level that is standard in the U.S. Then the participants, along with an alcohol-free control group, were shown a staged kidnapping on video. A week later the volunteers were asked to pick the kidnappers out of a lineup. All three groups of participants performed about the same—better than chance but poorly nonetheless. The poor showing was in keeping with prior studies. "Do Sober Eyewitnesses Outperform Alcohol Intoxicated Eyewitnesses in a Lineup?" Angelica Hagsand and four other authors, The European Journal of Psychology Applied to Legal Context (January) Intoxicated eyewitnesses are no less reliable than sober ones—but neither is very good at picking culprits out of a lineup.