Download
1 / 37
370 likes | 458 Vues
This study delves into the failure of scientific models in fisheries management, focusing on the collapse of Northern cod stock in Newfoundland. It explores the implications of inadequate management, impact on local economies, and the lessons learned for stock assessment. By analyzing age-structured population modeling, it questions the contribution of management models to the collapse of fish stocks. The text highlights challenges in estimating stock abundance and the need for tuning procedures to improve accuracy. Lessons from the Northern cod collapse offer valuable insights for sustainable fisheries management practices.

E N D
Can the models used in fisheries management conserve fish? C. Tara Marshall School of Biological Sciences University of Aberdeen Email: c.t.marshall@abdn.ac.uk
“Cod - It is amazingly prolific. Leewenhoek counted 9,384,000 eggs in a cod-fish of middling size -- a number that will baffle all the efforts of man to exterminate” -- J. Smith Homans Sr. & Jr. (1858) - quoted in "Cod" by Mark Kurlansky (1997)
If history repeats itself, and the unexpected always happens, how incapable must Man be of learning from experience George Bernard Shaw
Lecture outline • The collapse of the Newfoundland cod stock • The scientific models used to estimate stock abundance • How these models failed Newfoundland cod stock • How these models failed North Sea cod stock • Relevant highlights from the recent inquiry into the Scottish Fishing Industry (Royal Society of Edinburgh)
The collapse of the “Northern” cod stock • Commercial fishing began in the 16th century • Moratorium on fishing declared in 1992 • Since closure there has been little rebuilding and excessive mortality
1000000 800000 600000 Biomass (tonnes) 400000 200000 0 1958 1968 1978 1988 1998 Landings closely tracked the TACs but the stock collapsed anyhow (owing to “mismanagement” taxpayers of Canada were stuck paying the compensation) Year Landings TAC Example 1: Managing by TACs alone doesn’t work
After the moratorium 40,000 people in the five Maritime provinces became unemployed • Canadian government paid out over $4 billion in compensation • Compensation made continued attachment to the fishery profitable even in the absence of fish • Overcapacity remains a serious problem
The population decline observed in Newfoundland and Labrador has been attributed to the collapse of the cod fishery
11 years after closure of the fishery • Management advice in 2003: “without crisis management, the stock will not recover” • Northern cod was put on the “endangered” list on May 2 2003 May 9 2003 DFO offices were trashed by fishers demanding that the federal Fisheries Minister reverse his decision to close the cod fishery in the Gulf of St. Lawrence as a way to protect the dwindling stock
Did the models used in fisheries management contribute to the collapse of Northern cod?
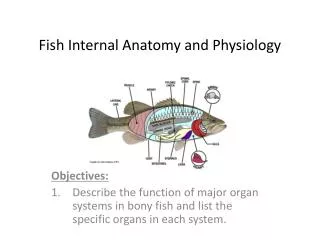
Natural mortality ( M = 0.2) Biomass Recruitment Fishing mortality (F) Growth To answer this we need to delve into the mechanics of age-structured population modelling If you remember only one thing from this talk, it should be this model
constant Starting point in the book-keeping N a+1,y+1 = N a,y e – (M + sa Fy) unknown We need a book-keeping method that keeps track of these basic elements (growth, recruitment, mortality and biomass) over time N a+1,y+1 - Numbers at age a+1 in year y+1 N a,y - Numbers at age a in year y e – (M + sa Fy) – survivorship after natural and fishing mortality saFy – the selectivity for age a times the fully selected fishing mortality in year y
Age Years Cohort analysis or Virtual population analysis Must make assumptions to get the calculations started In age-structured models we can go forward or backward through time to construct a matrix of numbers at age
Age Read along the diagonal to follow an individual cohort through time Terminal year Year
constant N a+1,y+1 = N a,y e – (M + sa Fy) unknown There is insufficient information to estimate the F in the most recent (or terminal) year. Without this, we cannot estimate abundance in the terminal year which prevents us from doing the backward reconstruction of abundance at age!
To get around this obstacle, “tuning” procedures have been developed which use auxiliary information to estimate F in the terminal year. This auxiliary information can include: • commercial landings of each age class (fisheries dependent information) • numbers of each age class caught by research vessel surveys (fisheries independent information)
Lessons for stock assessment from the northern cod collapse Walters, C. and Maguire, J.-J. 1996. Reviews in Fish Biology and Fisheries. 6: 125-137. • The terminal Fs were tuned so that the results would closely match the time trends in commercial catch rates expressed as catch per unit effort (CPUE) • CPUEs are an inherently biased estimate of stock abundance Can you think of a reason why?
The fishery is extremely good at locating fish + Fish school High CPUEs can be maintained until the very end
This causes F to be underestimated because abundance is being overestimated by using information from the commercial catch (generated by very non-random sampling!)
Spawning stock biomass (thou. t) What have we learned from the collapse of northern cod? Progressive revision downwards with each updated assessment Retrospective bias – F in the terminal year is consistently underestimated leading to downward revisions of abundance at age as the cohorts converge towards final values
Did retrospective bias contribute to the collapse of North Sea cod?
North Sea cod ICES sub-div IV, VIId, and IIIa 400000 Landings TAC 300000 Biomass (tonnes) 200000 100000 0 1962 1972 1982 1992 2002 Year Example 2: Managing by TACs alone doesn’t work
Retrospective bias has been detected in the North Sea cod stock “Since the mid 1990s, estimated reductions in fishing mortality in the final year of the assessment have been revised to higher F when more years of data became available.” ICES Adisory Council on Fisheries Management 2003
Retrospective bias in the North Sea cod stock assessment is now routinely examined Spawning stock biomass - overestimated Retrospective plots for North Sea cod Fishing mortality - underestimated Working Group on the Assessment of Demersal Stocks in the North Sea and Skagerrak ICES C.M. 2003
Year Basis of ICES Advice Advice Agreed TAC Landings 1987 SSB recovery; TAC 100-125 175 167 1988 70% of F(86); TAC 148 160 142 1989 Halt SSB decline; TAC 124 124 110 1990 80% of F(88); TAC 113 105 99 1991 70% of effort (89) 100 87 1992 70% of effort (89) 100 98 1993 70% of effort (89) 101 94 1994 Significant reduction 102 87 1995 Significant reduction 120 112 Difference between scientific advice and agreed can be quantified 1996 80% of F(94) 141 130 104 1997 80% of F(95) 135 115 100 1998 F(98) not exceed F(96) 153 140 114 1999 F=0.60 to rebuild SSB 125 132 80 2000 F less than 0.55 <79 81 62 2001 Lowest possible catch 0 48.6 42.3 2002 Lowest possible catch 0 49.3 44.2 2003 Closure 0 27.3 2004 Zero catch 0 Fisheries scientists now keep a paper trail! Stock summary for North Sea (Subarea IV)
North Sea cod 80 60 40 Agreed - Advice (thou. t) 20 0 1987 1989 1991 1993 1995 1997 1999 2001 2003 -20 -40 Year • Difference is not consistently positive (only in recent years is agreed consistently > advice) • This would suggest that the scientific advice has failed to conserve the North Sea cod stock
Chronology of the decline in North Sea cod • In 1997 scientists warned that North Sea cod stocks were about to collapse (Cook et al. 1997 Nature 385:521-522) • At that time the 1996 year-class was then estimated to be strong and management stated: “explicit measures to prevent targeting or wastage of this year-class should be implemented” • In 1997 and 1998 scientists advised a TAC of 135,000t and 153,000t, respectively, which were then estimated to correspond to Fs that were higher than target F of 0.6
Lessons for stock assessment from the northern cod collapse -> “retrospective problem” diagnosed Walters, C. and Maguire, J.-J. 1996. Reviews in Fish Biology and Fisheries. 6: 125-137. In 1997 and 1998 the advised TACs for North Sea cod were based on achieving a target F of 0.65 -> F for these years was shown retrospectively to be 0.85 and 1.06
Stock summary for North Sea (Subarea IV) High F after 1997 warning of stock collapse! * Considered uncertain
To put those F values into perspective: between 63 and 73% of stock was being removed annually
The recent Royal Society of Edinburgh Inquiry into the Scottish Fishing industry concluded: “Following the abundant 1996 year-class in the North Sea, scientists recommended increases in TACs. Had they recommended lower values, the current crisis in North Sea cod could have been averted. In retrospect, this would appear to be a major misjudgement in management” To download their report see: http://www.royalsoced.org.uk/
Furthermore, they noted: “There is a fundamental problem in trying to regulate F through TACs. If there is an error in estimation of SSB, … then F could vary considerably from the desired value. Management of the fishery through TACs is then doomed to failure; indeed, it appears to have consistently failed over two decades” To download their report see: http://www.royalsoced.org.uk/
Among their recommendations: • The EU Commission should manage demersal fish stocks so that F is much lower than over the past 15 years, aiming for a value of F<0.4 corresponding to removal of < 33% of the stock annually • Demersal stocks should be managed as a mixed fishery with a single overall limit on effort and no discarding To download their report see: http://www.royalsoced.org.uk/
Can the models used in fisheries management conserve fish? No – Northern cod; F too high and consistently underestimated No – North Sea cod; F too high and consistently underestimated
Yes – North Sea herring; use of VPA can be considered a success; F is currently around 0.25 and catches are stable Can the models used in fisheries management conserve fish? Such a low F means that errors in VPA and predicted catches are less critical Royal Society of Edinburgh. 2004 Inquiry into the future of the Scottish Fishing industry
In an analysis of “paper trails” like the ones shown here for North Sea cod (advised vs. agreed TAC) it was concluded that “more than any other factor examined, failure to comply with science advice greatly increases the risk of unsustainability” for flatfish stocks Management of flatfish fisheries – what factors matter? Rice, J and Cooper, J.A. 2003. J. Sea Res. 50: 227-243. Can the models used in fisheries management conserve fish?
Post mortems of cod crises Northern cod 1983: The Kirby Commission report 1987: The Alverson Commission 1989: Northern Cod Review Panel North Sea cod 2004: The Royal Society of Edinburgh 2004: The UK Fisheries Project