
Venn Diagrams
E N D
Presentation Transcript
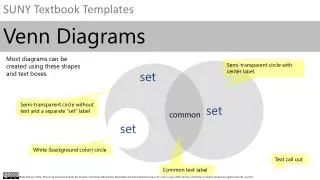
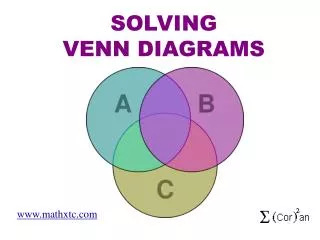
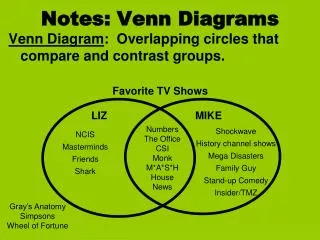
What is a Venn Diagram? • Graphic Organizer used to represent sets of data that differ and have similar characteristics • Simple Venn diagrams are used to represent two sets of data • Triple Venn diagrams are used to represent three sets of data (original diagram made by the creator) • They were created by John Venn in 1880 (http://www.enchantedlearning.com/inventors/page/v/venn.shtml)
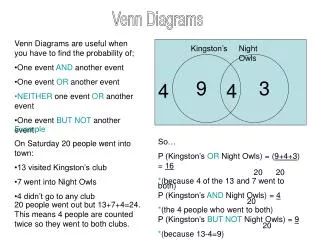
We can use them to find the GCF! • Find the GCF of 30 and 65. • Draw two circles that overlap • Label each circle factors of 30 and factors of 65 • Write out the factors of 30 inside the proper circle • Write out the factors of 65 inside the proper circle • Write out the factors that both numbers have in common in the overlapping part of the circles • The largest number in the overlapping circle is the GCF!! Factors of 65 Factors of 30 5 1 2 1 5 3 13 15 6 10 30 65
In your groups, complete a Venn diagram on a colored sheet of paper for 4 of the following! • Find the GCF of 32 and 48. • Find the GCF of 54 and 72. • Find the GCF of 36 and 144. • Find the GCF of 24, 32 and 64. • Find the GCF of 35, 49, and 84. • Find the GCF of 28, 56, and 84.