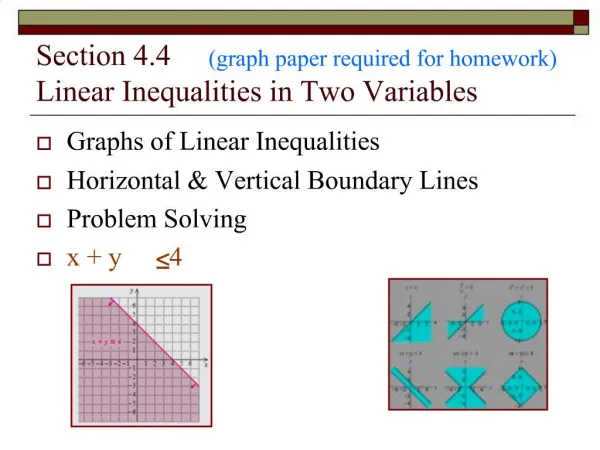
Graph linear inequalities in two variables
Graph linear inequalities in two variables. Section 6.7. Concept. Up until this point we’ve discussed inequalities that involve only one dimension or one variable Today we’re going to take our understanding of inequalities and apply it to two dimensions (variables )


Graph linear inequalities in two variables
E N D
Presentation Transcript
Graph linear inequalities in two variables Section 6.7
Concept • Up until this point we’ve discussed inequalities that involve only one dimension or one variable • Today we’re going to take our understanding of inequalities and apply it to two dimensions (variables) • First we will do a short review of lines and linear terms
Slope • Slope is • A. An index of the angle of a line • B. A ratio of how much a line increases versus how much to moves right of left • C. A ratio of run to rise • D. An index of movement in the x direction
Slope • What is the slope of the line that goes through the points (1,2) & (5,4)
Slope • What is the slope of the line that goes through the points (-4,-2) & (7,-8)
Slope • What is the slope of the line that goes through the points &
Slope • What is the slope of the line that goes through the points (5,2) & (5,4)
Slope • What is the equation of the line that goes through the points (1,3) & (3,7)
Slope • What is the equation of the line that goes through the points (-3,4) & (-5,-12)
Slope • What is the equation of the vertical line that goes through the point (3,-5)
Slope • The equation of a line is y=3x-9. The slope of the line is increased by 2. What happens to the line? • A. The line has the same y-intercept, but now slopes downward • B. The line has the same y-intercept, but is now steeper • C. The line has a different y-intercept, but now slopes downward • D. The line has a different y-intercept, but is now steeper
Slope • Assuming that the line starts at x=0, which line will reach y=50 first?
The big idea Y X • When we look at a line, we’re seeing the collection of points that are solutions to a linear equality • When looking at a linear inequality, instead of looking at a set of points, we are seeing a defined space that indicates the infinite collection of points that satisfy the criteria • For example This means that any point that falls in the shaded area is a viable solution to the inequality
Testing a point Y X • We can see this by testing out a point in the shaded area • For example It’s imperative that we remember that the solution to these inequalities is an area as opposed to a line (-6,3)
Process out of examples Y X • Our process for creating these graphs is not difficult, but rather just an extension of our previous knowledge of graphing Graph the line via linear graphing methods Draw a dashed line for >,< otherwise a solid line Shade the appropriate area Above for greater than Below for less than
Example Y X • Let’s do an example
Example Y X • How would we graph this one?
Example Y X • We would operate horizontal and vertical inequalities the same as any other inequality
Examples Y X
Example Y X • And another one
Example Y X • And another one
Practical Example Y X • A party shop makes giftbags for birthday parties. They charge $4 per glowstick and $10 per T-shirt. Let x represent the number of glowsticks and y the number of T-shirts. The goal is to earn at least $500 from the sale of the bags • Write an inequality that • describes the goal in • terms of x & y • Graph the inequality • Give three possible • combinations of pairs • that will allow the shop • to meet it’s goal
Most Important Points • What’s the most important thing that we can learn from today? • The solution to an inequality in two-dimensions is an area, as opposed to a line • We can graph the solutions to an equation by following our normal processes for graphing lines and then shading the appropriate area
Homework 6.7 you will have two days 1, 2-32, 47-50, 53-57