Download

1 / 24
1.14k likes | 2.32k Vues
3.3 Linear Inequalities in Two Variables. Objectives: Solve and graph a linear inequality in two variables. Use a linear inequality in two variables to solve real-world problems. Standard: 2.8.11.K. Apply an appropriate technique to graph a linear inequality.

E N D
3.3 Linear Inequalities in Two Variables Objectives: Solve and graph a linear inequality in two variables. Use a linear inequality in two variables to solve real-world problems. Standard: 2.8.11.K. Apply an appropriate technique to graph a linear inequality.
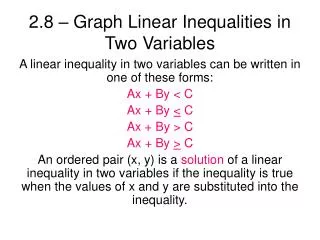
A linear inequality in two variables, x and y, is any inequality that can be written in one of the forms below, where A ≠ 0 and B ≠ 0.Ax + By ≥ C Ax + By > C Ax + By ≤ C Ax + By < C
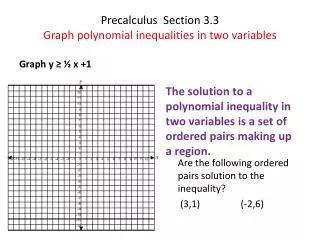
A solution of a linear inequality in two variables, x and y, is an ordered pair (x, y) that satisfies the inequality. The solution to a linear inequality is a region of the coordinate plane and is called a half-planebounded by a boundary line.
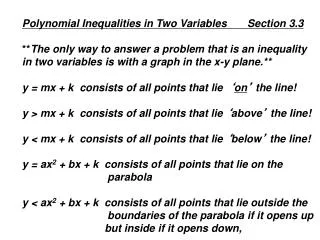
Graphing Linear Inequalities 1. Given a linear inequality in two variables, graph its related linear equation. • For inequalities involving ≤ or ≥, use a solid boundary line. • For inequalities involving < or >, use a dashed boundary line.
2. Shade the appropriate region. For inequalities in the form of y ≤ mx + b or y < mx + b, shade below the boundary line. For inequalities of the form y ≥ mx + b or y > mx + b, shade above the boundary line. For inequalities in the form x ≤ c or x < c, shade to the left of the boundary line. For inequalities in the form x ≥ c or x > c, shade to the right of the boundary line.
Ex 1. Graph each linear inequality. • a. y < x + 2
* c. y > -2x - 2 Dotted Line
f. 3x – 4y ≥ 4 -4y≥-3x + 4 y ≤ ¾ x - 1
g. -5x – 2y > 4 -2y > 5x + 4 y < -5/2 x - 2 Dotted Line
Ex 3. Graph each linear inequality. x is a vertical line and y is a horizontal line
d. y > -1 Dotted Line