Download
1 / 6
60 likes | 221 Vues
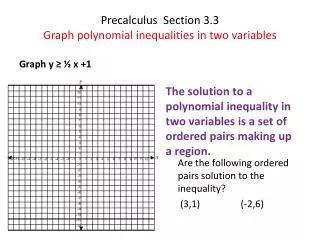
Polynomial Inequalities in Two Variables Section 3.3 ** The only way to answer a problem that is an inequality in two variables is with a graph in the x-y plane.** y = mx + k consists of all points that lie ‘ on ’ the line!

E N D
Polynomial Inequalities in Two Variables Section 3.3 **The only way to answer a problem that is an inequality in two variables is with a graph in the x-y plane.** y = mx + k consists of all points that lie ‘on’ the line! y > mx + k consists of all points that lie ‘above’ the line! y < mx + k consists of all points that lie ‘below’ the line! y = ax2 + bx + k consists of all points that lie on the parabola y < ax2 + bx + k consists of all points that lie outside the boundaries of the parabola if it opens up but inside if it opens down,
y > ax2 + bx + k consists of all points that lie within the boundaries of the parabola if it opens up but outside the boundaries if it opens down Example 1: Sketch the graph of y > x2 – 2x – 8 The proper way to ‘sketch’ this graph in this class: Find any and all x-intercepts: Take x2 – 2x – 8 = 0 Factor: (x – 4)(x + 2) = 0 Solve for x: x = 4, x = - 2 Now find y-intercept – which is always ‘k’ in this expanded form: - 8 Now find vertex: We have reviewed and reviewed this: You must show an algebraic process. V: = (1, - 9) Now plot the vertex, y-intercept, (the symmetry point to the y-intercept), and the roots. Since no = sign is involved in this inequality, connect all this points with a ‘dotted curve’. According to the above directions, you will now shade all points inside the parabola since we are working with > and it opens up. Check out the graph for example #1 found on page 105 in your book.
Example 2: Graph the solution set of the inequalities: y < 4 – x2 and y > x + 2 Show an algebraic method as described earlier for the parabola. Since we are using < the curve is solid and we shade inside the boundaries of this curve since it opens down. Graph the line using slope and y intercept. This line will be ‘dotted’ since there is no = sign We will shade ‘above’ the line since the symbol is > Final shaded area is above the ‘dotted line’, but inside the boundaries of the solid parabola. Check out the solution for Example 2 found on page 105 ** Note: If an inequality contains just one variable, you must be aware of whether you are working just on the number line or in the whole coordinate plane. There are actually two possibilities for the inequality x > 3
Example 3: • Sketch the graph of | x + 1 | > 3 • Since there is absolute value located around a variable, we must make ‘2’ inequality • statements. x + 1 < - 3 ‘or’ x + 1 > 3 • Solving both for ‘x’ x < - 4 or x > 2 • Now since there were no specific directions for how to represent this solution we could: • a) Show a number line with open circles at - 4 and 2 and shade the ‘exterior’ area of • these two points. • Go to the x-y plane, and graph two ‘dotted’ vertical lines and again shade the • exterior area away form these two vertical lines. • Example 4: • Sketch the graph of y < x3 + 2x2 • Start by finding all x-intercepts: x3 + 2x2 = 0 • factor out and x2 x2(x + 2) = 0 • x = 0 (double root) and x = - 2 • Show any y-intercepts y = 0 • Since ‘a’ is a positive 1 graph ‘rises’ • Make a rough sketch solid curve ( <) and bounces at x = 0 • Pick a test point to decide where you will shade (0,0) cannot be used here!
Extra info: Since this section is dealing with inequalities in ‘two variables, the inequality x < -2 is talking about a graph which is the ‘dotted’‘vertical line’ at x = - 2 and then shading all the ordered pairs when x < - 2 Likewise, the inequality 0 <y< 3 is an inequality that is talking about the solid horizontal lines at y = 0 and y = 3, Then you are describing all the ordered pair that fall in between these two horizontal lines.
Also remember | x | < 2 stands for the statements, - 2 < x < 2 or if you desire x > - 2 AND x < 2 But, | x | > 3 can only be represented as: x > 3 OR x < -3 No combining these two into one statement! Please memorize these principles Hw pg 106 CE: #1-10 all, WE: #1-19 odd