Download

1 / 8
110 likes | 300 Vues
Graphing Inequalities in Two Variables. Example Y<-x+1. Half-Planes and Boundries. Half-Plane. Half-Plane. Boundary. Steps to Graph. 1. Solve for y in terms of x 2. Use slope-intercept (=) to graph line 3. Decide on solid or dotted line 4. Test points to find region to shade in.

E N D
Graphing Inequalities in Two Variables Example Y<-x+1
Half-Planes and Boundries Half-Plane Half-Plane Boundary
Steps to Graph • 1. Solve for y in terms of x • 2. Use slope-intercept (=) to graph line • 3. Decide on solid or dotted line • 4. Test points to find region to shade in
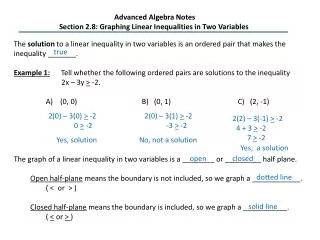
Which of the following ordered pairs are part of the solution set for 3x+2y<12? {(3,0),(2,2)}
Which of the following ordered pairs are part of the solution set for 4x+2y>8? Graph
Homework: p356 # 12, 20-23all, 26, 28, 30 You may work in pairs as long as you work on math andwork quietly SEPARATE YOURSELVES Use your time wisely Ask questions if needed If you finish there is no HW for the weekend!