Graphing Linear Inequalities in Two Variables
Graphing Linear Inequalities in Two Variables. Objective: Graph all of the solutions to a linear inequality. Steps to Remember. Rewrite the inequality so that it is in slope-intercept form y = mx + b Plot the y-intercept (b) Use the slope (m) to find other points on the line.


Graphing Linear Inequalities in Two Variables
E N D
Presentation Transcript
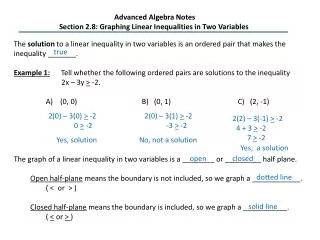
Graphing Linear Inequalities in Two Variables Objective: Graph all of the solutions to a linear inequality
Steps to Remember • Rewrite the inequality so that it is in slope-intercept form • y = mx + b • Plot the y-intercept (b) • Use the slope (m) to find other points on the line. • Draw the line • Solid if <= or >= • Dotted if < or > • Shade above or below the line • Above if > or >= • Below if < or <=
Example 1 Graph y > 2x -5 The equation is already in slope-intercept form. Start by plotting the y-intercept (b = -5)
Example 1 (cont) Graph y > 2x -5 Now use the slope to find other points on the line
Example 1 (cont) Graph y > 2x -5 Draw a dotted or solid line through the coordinates. This line will be dotted since the inequality is >
Example 1 (cont) Graph y > 2x -5 Shade above the line to show all of the coordinates that are solutions.
Example 2 Graph 2x - 5y >=15 First, solve for y … -5y >= -2x + 15 y <= 2/5 x – 3 Now go through the steps of graphing.
Example 2 Graph 2x - 5y >=15 y <= 2/5 x – 3 Plot the y-intercept
Example 2 Graph 2x - 5y >15 y <= 2/5 x – 3 Use the slope to find other points
Example 2 Graph 2x - 5y >15 y <= 2/5 x – 3 Draw a solid line through the points.
Example 2 Graph 2x - 5y >15 y <= 2/5 x – 3 Shade below the line
Special Example • Graph x > 5 • Remember the graph will be a vertical line.
Special Example • Graph y< -2 • Remember the graph will be a horizontal line.