Bode Plot Analysis and Exam Schedule for EE4201 - July 2023
This announcement outlines important details for EE4201, including the last homework on Bode plots and the submission deadlines for Lab#3 and Lab#4 reports. It also provides the schedule for upcoming tests: Exam IV will be held on July 24 as an open-book exam, and the final exam will follow on July 29, based on the content of the previous four tests. Additionally, it emphasizes the key concepts of Nyquist and Bode diagrams, including their mathematical backgrounds, system responses, and control design principles.

Bode Plot Analysis and Exam Schedule for EE4201 - July 2023
E N D
Presentation Transcript
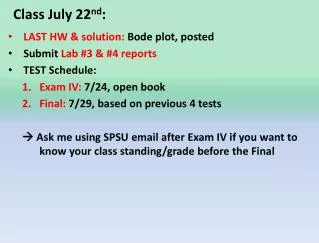
Class July 22nd: • LAST HW& solution: Bode plot, posted • Submit Lab#3 & #4 reports • TEST Schedule: • Exam IV: 7/24, open book • Final: 7/29, based on previous 4 tests Ask me using SPSU email after Exam IV if you want to know your class standing/grade before the Final
Mathematical Backgrounds – Bode Diagram • Complex Numbers • Logarithm • Bode Diagram • Magnitude: 20 log M • Phase: ф Format:
Single pole or zero, s = 0 (i.e. at the origin), 20dB/decade
Bode Plot: Magnitude, 20dB/decade per Order 40dB/decade
Bode Plots: Actual & Asymptotic 20dB/decade
Bode Diag.: Phase • Constants • Pole(s) & Zero(s) at the origin • Non-zero real Pole(s) & Zero(s)
Bode Plots: Actual & Asymptotic 450/decade
Bode Plot: Phase, 450/decade per Order 900/decade
EX. 1: Bode Plot Numerator,N(jw) Denominator,D(jw)
Other Examples at HOME • Example 10.2 in the textbook
Dynamic System & Control Design U(s) Dynamics Model & Sys. Knowledge Mathematics Control (T.F.)
Dynamic System & Control Design U(s) (T.F.) • Modeling of dynamic systems • System characteristics & response (performance) • Control designs
EE4201: Learned • Modeling of linear dynamics systems: ODE L.F. T.F. • System characteristics & stability: C.E. Q(s) = 0 • Control system design: analytically & graphically IN3: Technical Insight, Inspiration & Intuition to solve a problem