Download
1 / 61
610 likes | 817 Vues
Statistical Genetics 6 GWAS Data QC. Graduate School of Medicine Kyoto University 2008/09/17-25 IMS-UT Ryo Yamada. Phenotype. Marker. Subjects. Genotypes. Single marker-single phenotype test.

E N D
Statistical Genetics6 GWAS Data QC Graduate School of Medicine Kyoto University 2008/09/17-25 IMS-UT Ryo Yamada
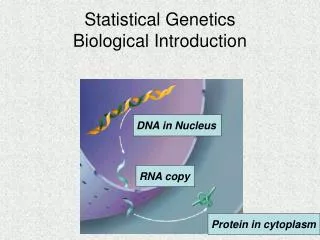
Phenotype Marker Subjects Genotypes Single marker-single phenotype test Through genotype data as a co-attribute both of subjects and marker, relation between phenotype and marker is tested. This test depends on randomness of subjects except for the phenotype.
Test statistics for simple tests Phenotype(s) Correction for GWA MarkerS Structured Subjects Genotypes GWA study Individual test assumesrandomness of subjects except for the phenotype. The statistics based on the assumption is corrected by difference between random distribution of unbiased condition and random distribution of biased condition. Tests (markers) are not independent each other. The statistics based on the dependency is corrected by evenness of dependency throughout the tests.
GWA study • Biased samples • Population structure • Structure in sampling population overall • Biased sampling from structured population • Dependency among tests • Allelic association • Linkage disequilibrium • Allelic association due to population structure • Dependency among tests that share markers and/or subjects.
The assumption is corrected by difference between random distribution of unbiased condition and random distribution of biased condition. Deviated records are important for correction. Do not throw away data records unless specified causative mistake(s) are reasonably certain. Throw away data records when appropriate so that the discard won’t disturb the beauty of distribution.
Steps • Check study design • Check input data • Run analyzing applications • Interpret the outputs • How to survive with “endless requests” along with our own research projects?
Check study design • Check input data • Run analyzing applications • Interpret the outputs • How to survive with “endless requests” along with our own research projects? Design • List subjects • List phenotypes • List markers • Study design is simple or not? • Dependency among tests that share markers and/or subjects.
Check study design • Check input data • Run analyzing applications • Interpret the outputs • How to survive with “endless requests” along with our own research projects? Phenotype data for population genetics sex, self-identified ethnicity, birth place... Phenotype data of interest Disease Location data of markers and genes Methods Input conditions Annotation Data processing Markers Subjects Marker-specific materials for assays DNA samples Other materials and machines and assay conditions Assay experiments Genotype data Descriptive statistics Test
Check study design • Check input data • Run analyzing applications • Interpret the outputs • How to survive with “endless requests” along with our own research projects? Check input data with genotype data sets • Targets of data-check are • NOT data records themselves • BUT items used when they were produced • Condition of data recording of phenotypes • Method of annotation • DNAs, marker-specific and non-specific reagents and other assay conditions
Check study design • Check input data • Run analyzing applications • Interpret the outputs • How to survive with “endless requests” along with our own research projects? Check input data with genotype data setsCheck WITHOUT genetic knowledge • Examples • Markers with successful call rate far lower than maker populations (w.c.r.l.p) should have a marker-specific cause. • Samples w.c.r.l.p should have a sample-specific cause. • A assay batch w.c.r.l.p should have a batch-specific cause. • # “far lower” has to be judged in the multiple testing context.
Check study design • Check input data • Run analyzing applications • Interpret the outputs • How to survive with “endless requests” along with our own research projects? Check input data with genotype data setsCheck WITH genetic knowledge • Examples • A data set of markers annotated in regular X region and samples with male phenotype identifies mislabeling of sex-phenotype and/or marker annotation with their unlikeliness. • A sample pair with far more similar genotypes than pair-population identifies DNA contamination (or genetic kinship depending on the resemblance). • # “unlikeliness” and “far more similar” has to be judged in the multiple testing context.
The assumption is corrected by difference between random distribution of unbiased condition and random distribution of biased condition. Deviated records are important for correction. Do not throw away data records unless specified causative mistake(s) are reasonably certain. Throw away data records when appropriate so that the discard won’t disturb the beauty of distribution.
Test statistics for simple tests Phenotype(s) Correction for GWA MarkerS Structured Subjects Genotypes • Check study design • Check input data • Run analyzing applications • Interpret the outputs • How to survive with “endless requests” along with our own research projects? Test • Multivariate study, but... • Multiple monovariate tests & appropriate (or appropriately attempted) corrections • Or partially multivariate-ize????
c1-1 Phenotype c1-2 c2-1 P1 Marker Subjects c2-2 c3-1 Genotypes c3-2 P2 A1 c4-1 c4-2 A2 c5-1 c5-2 Shuffle these connections under the assumption of independence Single marker-single phenotype test (1) Independence test {P1,P2} ⇔{A1,A2} (2) Test of difference of frequency of A1 between P1 and P2
~Haplotype and Diplotype~ Genotype(diplotype) Phenotype or population Chromosome Individual Allele(haplotype) Inheritance mode c1-1 D1 S1 c1-2 G1 D2 c2-1 P1 S2 G2 c2-2 c3-1 S3 G3 R1 c3-2 P2 A1 c4-1 S4 R2 c4-2 Shuffle here! S5 A2 c5-1 c5-2
Genotype(diplotype) Phenotype or population Chromosome Individual Allele(haplotype) Inheritance mode c1-1 D1 S1 c1-2 G1 D2 c2-1 P1 S2 G2 c2-2 c3-1 S3 G3 R1 c3-2 P2 A1 c4-1 S4 R2 c4-2 Shuffle here! S5 A2 c5-1 c5-2 Dominant trait test Allele test 2x3 contingency table test Recessive trait test
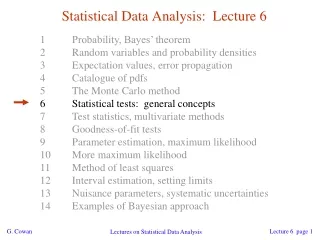
Methods to test • Contingency table test • Asymptotic distribution tests • Pearson’s Chi-square • Chi-square statistics for trend • incl. Armitage-Cockran’s trend statistics • Exact probability test corresponding to above asymptotic tests • Individual data-based test • Logistic regression test • Likelihood ratio test
Genotype(diplotype) Phenotype or population Chromosome Individual Allele(haplotype) Inheritance mode c1-1 D1 S1 c1-2 G1 D2 c2-1 P1 S2 G2 c2-2 c3-1 S3 G3 R1 c3-2 P2 A1 c4-1 Dominant trait test S4 R2 c4-2 Allele test 2x3 contingency table test Shuffle here! Recessive trait test S5 A2 c5-1 c5-2 What were observed and which table should be used? Use tests that are based on 2x3 table or individual records 2x2 tables arithmetically calculated from 2x3 table are not exact.
Test statistics for simple tests Phenotype(s) Correction for GWA MarkerS Structured Subjects Genotypes • Check study design • Check input data • Run analyzing applications • Interpret the outputs • How to survive with “endless requests” along with our own research projects? • Population structure • Multiple testing ⇔Test-independence
Sampling from a structured population Even sampling Biased sampling
Genomic control method • Variance of statistics inflates with population structure.
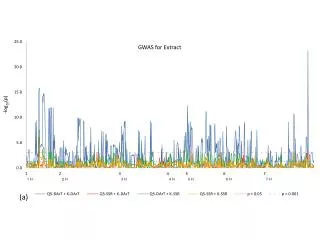
P値 P-value Many significant results when samples are biased with population structure. Markers P値昇順プロット
χ2GC = λχ2 to fit concaved line into y=x line GC corrects the inflation but does not incorporate structure information to increase power. λ is a good index to describe degree of structure.
Eigenstrat • identify eigenvectors to represent SNPs and to discriminate samples and utilize the eigenvectors to test association between phenotype and markers
Up to here:Routines for GWA From here:Would be Optional for GWA, particularly 1st stage screening
List of optional analyses for now • Multiple testing correction * • Evaluation of coverage of genome (~ Hapmap SNPs) with genotyped panel * • Phenotype-segment association with haplotype-based association tests * • Staged design and power-definition of GWA • Epistatic investigation • Multi-phenotype stratification
Multiple testing ⇔Test-independence Fraction(P1<0.1 or P2<0.1) P2 P2 P1 P1 P1 137/1000 190/1000 78/1000
ExampleCumulative probability density of minimal P value in Monte-Carlo permutation in a GWA Log
Coverage of genome • Commertial scan panels select tagging SNPs based on HapMap data so that all SNPs are surrogated by a SNP with LD more than threshold. • Based on observed scan genotype data, the real coverage can be re-calculated. • Less covered region might be tested with SNP-combinations (haplotypes) to even out strucy density.
Haplotype-based association testsEpistatic evaluation • I would say no gold standard for these in the context of GWA-scan.
Multi-phenotype stratification • Mantel-Haenzel test
Check study design • Check input data • Run analyzing applications • Interpret the outputs • How to survive with “endless requests” along with our own research projects? • Many tools are publicly available and useful. • They might not do everything we want to do but at least a part of them. • Let them do what they can do • Example • plink + Haploview + Eigenstrat
Single marker-single phenotype test~Haplotype and Diplotype~ c1-1 D1 S1 c1-2 G1 D2 c2-1 P1 S2 G2 c2-2 c3-1 S3 G3 R1 c3-2 P2 A1 c4-1 S4 R2 c4-2 S5 A2 c5-1 c5-2
Multiple testing ⇔Test-dependence Fraction(P1<0.1 or P2<0.1) FWER-correction ~ Bonferroni Test dependence ~ Allelic association P2 P1 P1 P1 137/1000 173/1000 78/1000
Check study design • Check input data • Run analyzing applications • Interpret the outputs • What to do next? • How to survive with “endless requests” along with our own research projects? Input data (1) • Subjects • “Random” samples except for phenotypes of interests ? -> NO! • “Genetic randomness ~ population structure” are to be checked. • Self-identified ethnicity and sampling location can be used to interpret the genetic structure.
Check study design • Check input data • Run analyzing applications • Interpret the outputs • What to do next? • How to survive with “endless requests” along with our own research projects? Input data (2) • Subjects • “Random” samples except for phenotypes of interests ? -> NO! • “Genetic randomness” are to be checked.
ゲノムワイドアソシエーションスタディにおける、多仮説検定事情ゲノムワイドアソシエーションスタディにおける、多仮説検定事情 第2回 インフォマティクス研究者と医学研究者の交流会 平成19年11月22日-23日 東京大学 柏キャンパス 東京大学医科学研究所 ヒトゲノム解析センター ゲノム機能解析分野 山田 亮 今日のスライド全体はこちらからたどれます http://func-gen.hgc.jp/lecture/menu.htm
内容 • 仮説検定と、複数の独立な仮説の検定について • ゲノムワイド関連遺伝子解析における、非独立な仮説の存在 • その適用手法を眺めてみる • Diploidであること • ハプロタイプで解析すること • 時間が残れば・・・ • 複数のスタディを統合すること
そもそもGWAで、タイプ1エラーの正確さを云々しても『せんない』のではないか、という議論もあるそもそもGWAで、タイプ1エラーの正確さを云々しても『せんない』のではないか、という議論もある • False Discovery Rate(FDR)のように、関連陽性マーカー比率を設定して順位付けをすることもありかもしれない • 。。。。でも。
形質(疾患) 多マーカーでの関連解析 マーカー 形質と第1マーカーとに強い関連がある ???????
独立な検定とは • もし関連がない母集団からたくさんのサンプリングを繰り返すと・・・ • P<=0.01が得られる確率は0.01 • P<=0.05が得られる確率は0.05 • P<=0.5が得られる確率は0.5 • P<=0.05が得られる確率と0.05<P<=0.1が得られる確率は等しくて、0.05
When 100 independent tests are performed.... P-P plot of p value 期待値p 観測したp値をソートする。 小さい方からi番目のp値の期待値は i/(100+1). 最小P 期待値=1/101 観測値 p
独立仮説検定のための多重検定補正 • ボンフェロニ補正 • k個の(独立な)仮説を検定したら、 • pc=pn x k • pc: 補正後のp • pn: 補正前のp • Family-wise error rate • k個の(独立な)仮説を検定したら、その中の最小のpnがqである確率は • 1-(1-q)k~qk • ボンフェロニ補正とほぼ同じ
2つの独立な仮説でのP値 0.05 -D=0.0475 1-B-C-D = 0.95 x 0.95 = 1-0.0975 = 0.9025 B A 仮説2 どちらかの仮説でP<=0.05となる確率はB+C+D=0.0975 0.05 D C 0.05 -D=0.0475 0.05x0.05=0.0025 0.05 仮説1
100個の独立仮説検定のセットを100回繰り返した。その最小P値の分布100個の独立仮説検定のセットを100回繰り返した。その最小P値の分布 FWER補正の分布 1-(1-q)k ボンフェロニ補正の分布 pc=pn x k
サンプル • 対称7疾患 • 躁鬱・冠動脈・クローン・高血圧・関節リウマチ・1型糖尿病・2型糖尿病 • 共通コントロール • 2000人ケースx7疾患+3000人コントロール • マーカー • 500,000SNPs • 検定 • 2x3テーブル • 自由度2テスト、トレンドテスト • 層別化データ解析 • Mantel-Haenszel テスト • 集団構造化 • 英国内12地域 • 結果 • 5x10^(-7)シグナル 24個
相互に独立な多数の仮説 • ある形質 • 独立に集められたサンプル • 多数のマーカー • マーカーは独立 • 1つのマーカーについて1テスト