Class GWAS
Class GWAS. Go to genotation.stanford.edu Go to “traits”, then “GWAS” Look up your SNPs Fill out the table Submit information. Class GWAS. Class should split into groups (~4/group) Choose a trait

Class GWAS
E N D
Presentation Transcript
Class GWAS Go to genotation.stanford.edu Go to “traits”, then “GWAS” Look up your SNPs Fill out the table Submit information
Class GWAS • Class should split into groups (~4/group) • Choose a trait • Each group should calculate association of all 5 SNPs with your trait. Use allele frequency to start. • Discuss with your team how to do this. • Ask us if you have questions • Raise your hand when you have results • We will make a table from the class results • http://stanford.edu/class/gene210/files/writeups/2012/gwas_notes_AM.pdf
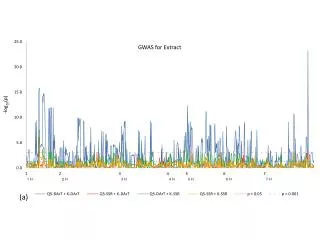
Class GWAS Which SNP is best associated with which trait? Is this significant? What should be the significance cut off? Are there other significant associations? What might cause the other significant associations?
Class GWAS • Each group should calculate association of all 5 SNPs with your trait. Use a recessive model. • Discuss with your team how to do this. • Ask us if you have questions • Raise your hand when you have results • We will make a table from the class results • http://stanford.edu/class/gene210/files/writeups/2012/gwas_notes_AM.pdf
Allelic odds ratio: ratio of the allele ratios in the cases divided by the allele ratios in the controlsCalculate this for the best SNP in your trait How different is this SNP in the cases versus the controls?
Allelic Odds Ratio Example Can Taste Bitter? rs713598 G seems to be enriched in the bitter tasters. How much? Bitter tasters: G/C = 57/31 = 1.83 Not bitter tasters: G/C = 6/22 = .273 Allelic Odds Ratio = 1.83/.273 = 6.7 This is huge. Remember, for colorectal cancer, OR for rs6983267 was 1.37 http://stanford.edu/class/gene210/files/writeups/2012/gwas_notes_AM.pdf
Likelihood Ratio ExampleGiven a risk allele, what is the likelihood of having the disease? Can Taste Bitter? rs713598 The probability of G in the bitter tasters is: 57/(57+31) The probability of G in the non-tasters is: 6/(6+22) The likelihood ratio is 3.02 (note LR is not the same as OR (6.7)) http://stanford.edu/class/gene210/files/writeups/2012/Odds_Ratio_and_Likelihood_Ratio.pdf
Increased Risk ExampleWhat is the likelihood of seeing a trait given a genotype compared to the overall likelihood of seeing that trait? Can Taste Bitter? rs713598 For CC, 10/11 do not taste bitter = .91 For entire class, 15/61 do not taste bitter = .26 Increased Risk = .91/.26 = 3.5 http://stanford.edu/class/gene210/files/writeups/2012/Odds_Ratio_and_Likelihood_Ratio.pdf
Lactose Intolerance Rs4988235 Lactase Gene A/G A – lactase expressed in adulthood G – lactase expression turns off in adulthood
Eye Color Rs7495174 In OCA2, the oculocutaneous albinism gene (also known as the human P protein gene). Involved in making pigment for eyes, skin, hair. accounts for 74% of variation in human eye color. Rs7495174 leads to reduced expression in eye specifically. Null alleles cause albinism
Ear Wax Rs17822931 In ABCC11 gene that transports various molecules across extra- and intra-cellular membranes. The A allele is loss of function of the protein. Phenotypic implications of wet earwax: Insect trapping, self-cleaning and prevention of dryness of the external auditory canal. Wet earwax: linked to axillary odor and apocrine colostrum.
Ear Wax Rs17822931 “the allele A arose in northeast Asia and thereafter spread through the world.”
Asparagus Certain compounds in asparagus are metabolized to yield ammonia and various sulfur-containing degradation products, including various thiols and thioesters, which give urine a characteristic smell. Methanethiol (pungent) dimethyl sulfide (pungent) dimethyl disulfide bis(methylthio)methane dimethylsulfoxide (sweet aroma) dimethylsulfone (sweet aroma) rs4481887 is in a region containing 39 olfactory receptors
Bitter taste Rs713598 Taste receptor 2 member 38 accounts for up to 85% of the variation in PTC tasting ability