Genome-Wide Association Study of Barley Cultivars: Significance of Marker Types for Trait Analysis
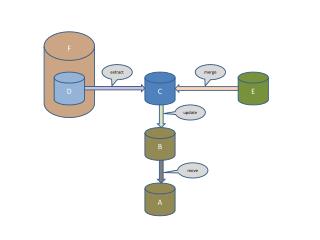
This study presents the results of genome-wide association analyses (GWAS) of 183 barley cultivars focusing on two traits: extract and thousand grain weight (TGW). The analysis incorporates population structure (Q) and kinship (K) using SSR and DArT markers. We assessed the effect of marker type on significant association results by applying different combinations in a mixed linear model (MLM). Calculated p-values were transformed to –log10(p), with significance thresholds marked. Our findings contribute to understanding the genetic basis of key agricultural traits in barley.

Genome-Wide Association Study of Barley Cultivars: Significance of Marker Types for Trait Analysis
E N D
Presentation Transcript
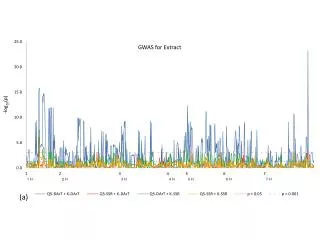
GWAS for Extract -log10(p) (a)
GWAS for TGW -log10(p) 1 H 2 H 3 H 4 H 5 H 6 H 7 H (b)
Electronic Supplementary Material Fig. 5 Genomewide association studies of 183 barley cultivars considering the MLM_QK for four traits (a) extract, and (b) thousand grain weight. Population structure (Q) and kinship (K) was taking into account by using the Q5 matrix calculated either with SSR- or DArT markers. This information was used in different combinations on the MLM in order to assess the effect of the marker type on the rate of signifianct association results (MLM_1 = Q5-DArT + K-DArT, MLM_2 = Q5-SSR + K-DArT, MLM_3 = Q5-DArT + K-SSR, MLM_4 = Q5-SSR + K-SSR). The calculated p-values were converted into –log10(p). The significance thresholds p < 0.05, and p < 0.001 are indicated by dashed lines.