Download
1 / 9
90 likes | 288 Vues
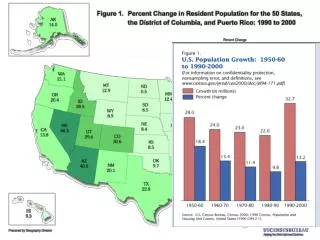
Metro. Non-Metro. Distribution of Metro/ Non Metro Counties. Percentage: 77.1. Spatial Distribution: White flight from central cities to suburbs; from suburbs to other cities. Total Percentage: 12.9. Majority: In South (54%), concentrated in counties. Percentage: 12.

E N D
Metro Non-Metro Distribution of Metro/ Non Metro Counties
Percentage: 77.1 Spatial Distribution: White flight from central cities to suburbs; from suburbs to other cities
Total Percentage: 12.9 Majority: In South (54%), concentrated in counties
Percentage: 12 Approximately half of the Hispanic population in the U.S. lives inside central cities of metropolitan areas. • Hispanics are less likely to reside in nonmetropolitan areas than non-Hispanic Whites. • Hispanics are more likely to reside in the West than non-Hispanic Whites.